|
|
May 2026 San Francisco House & Condo Markets
Market Outlook
|
|
|
|
|
|
|
|
|
San Francisco Real Estate
|
|
|
|
|
|
|
Clients, friends, and colleagues:
As we approach the end of May, the San Francisco spring market continues to gain momentum, with buyer activity remaining strong across both the single-family and condo segments.
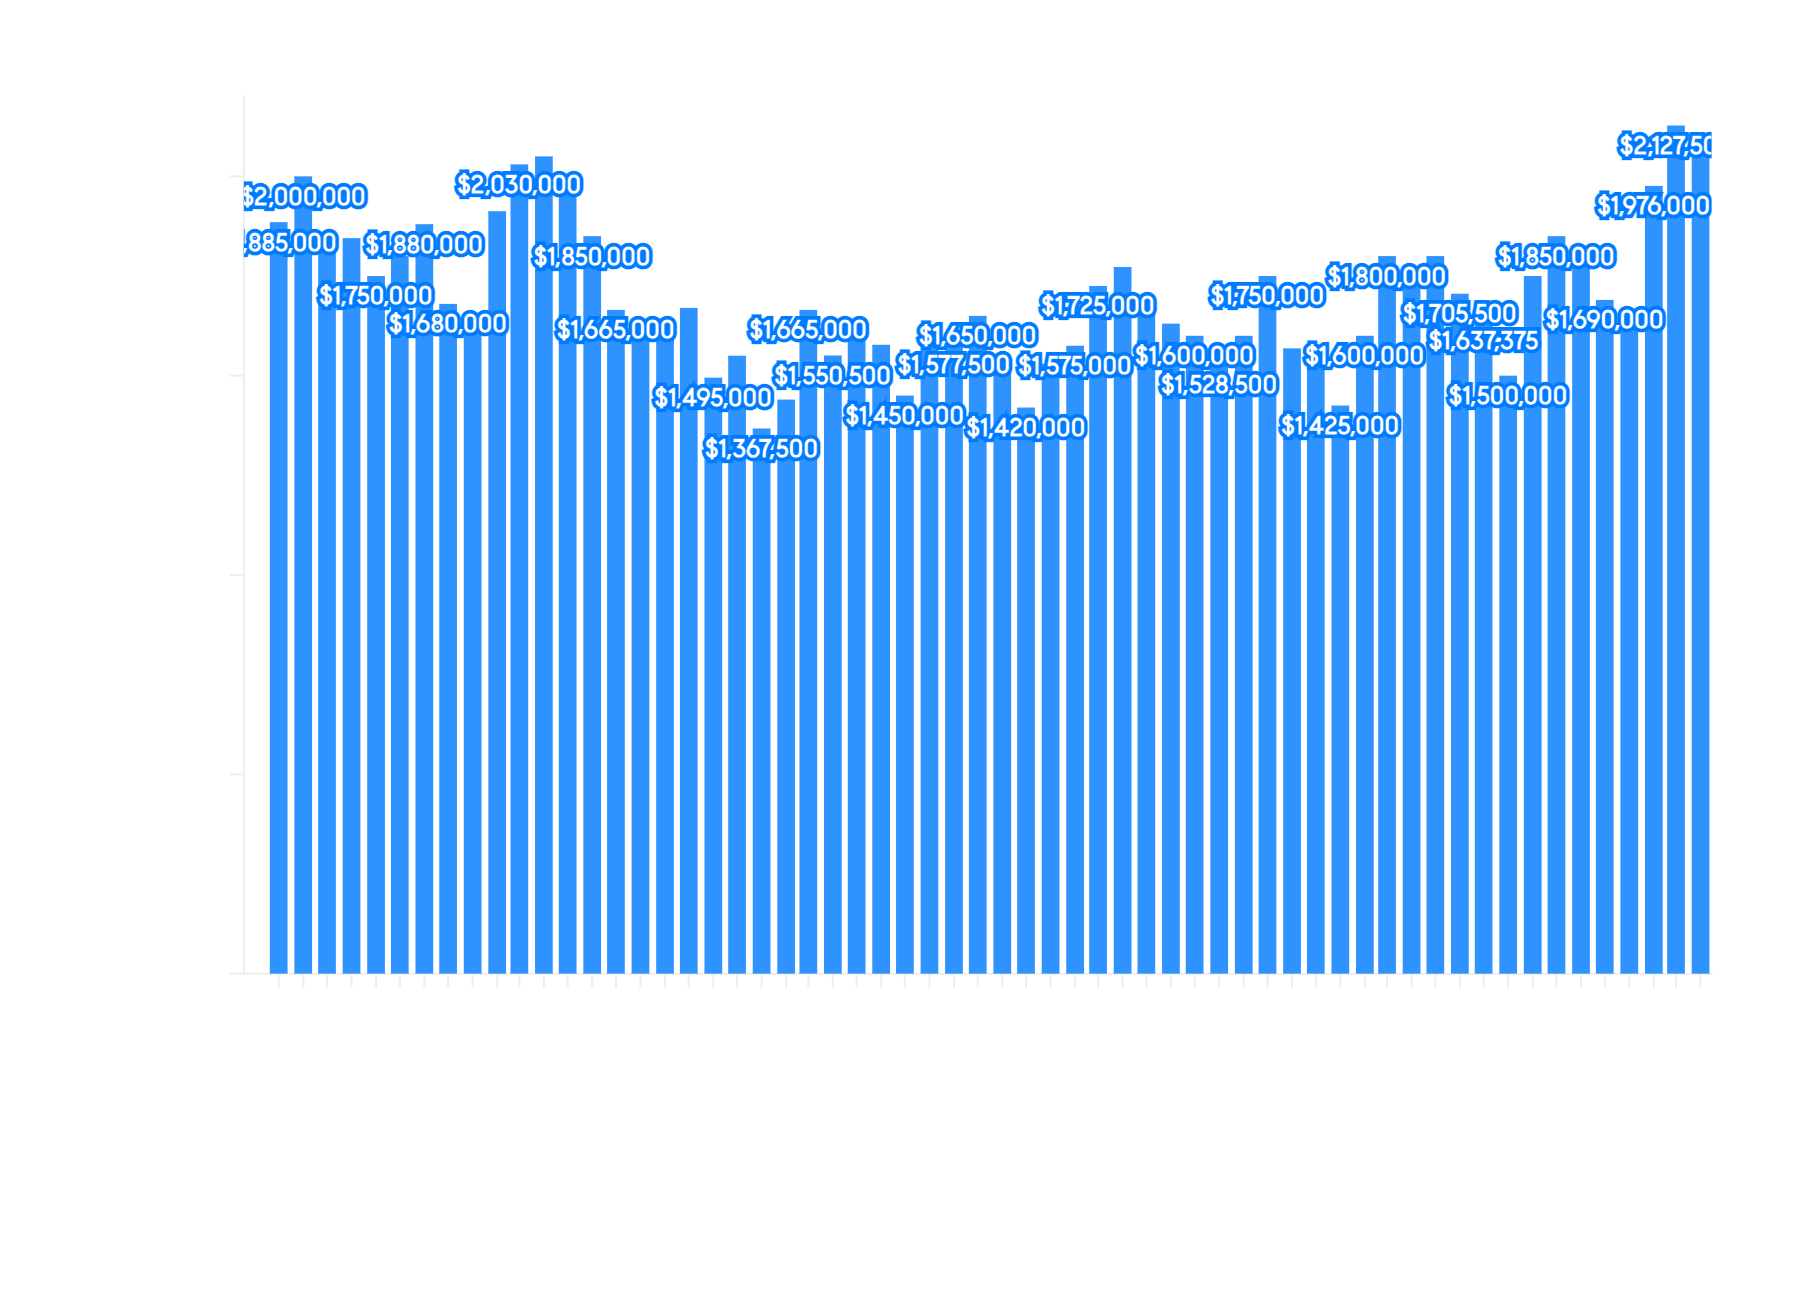
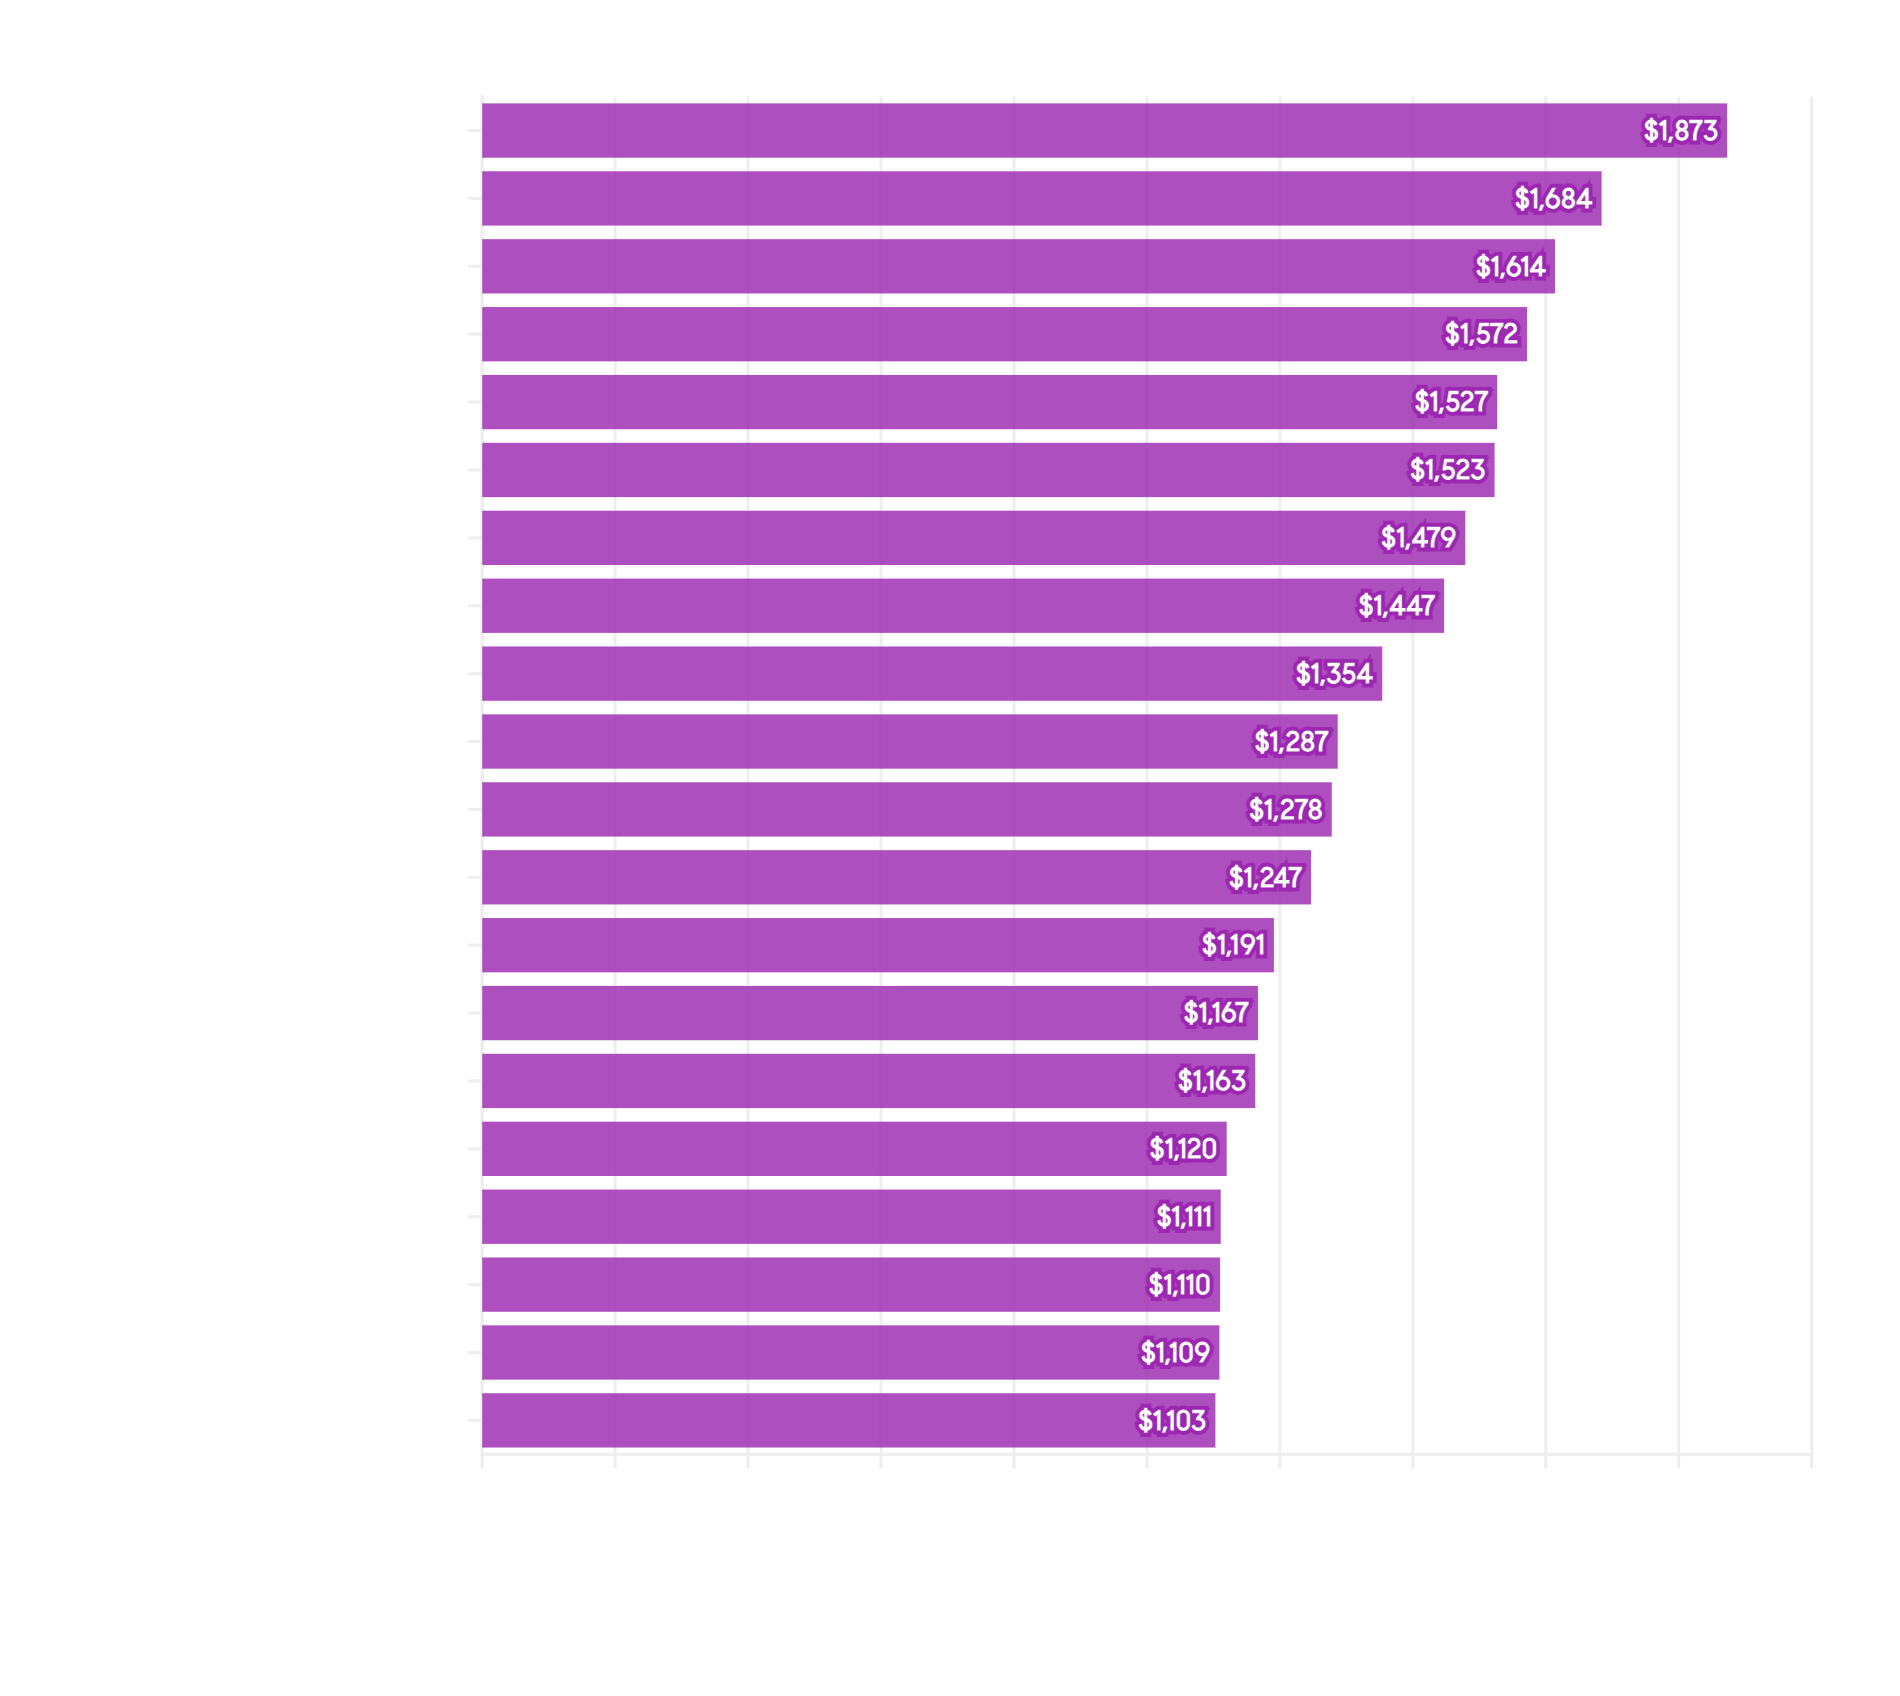
Constrained inventory combined with sustained demand is continuing to create a highly competitive environment, particularly for well-positioned homes. The median house sales price in April reached approximately $2,127,500 and surpassed the previous peak set in April 2022, while median condo prices climbed to roughly $1,350,000, also trending near historic highs.
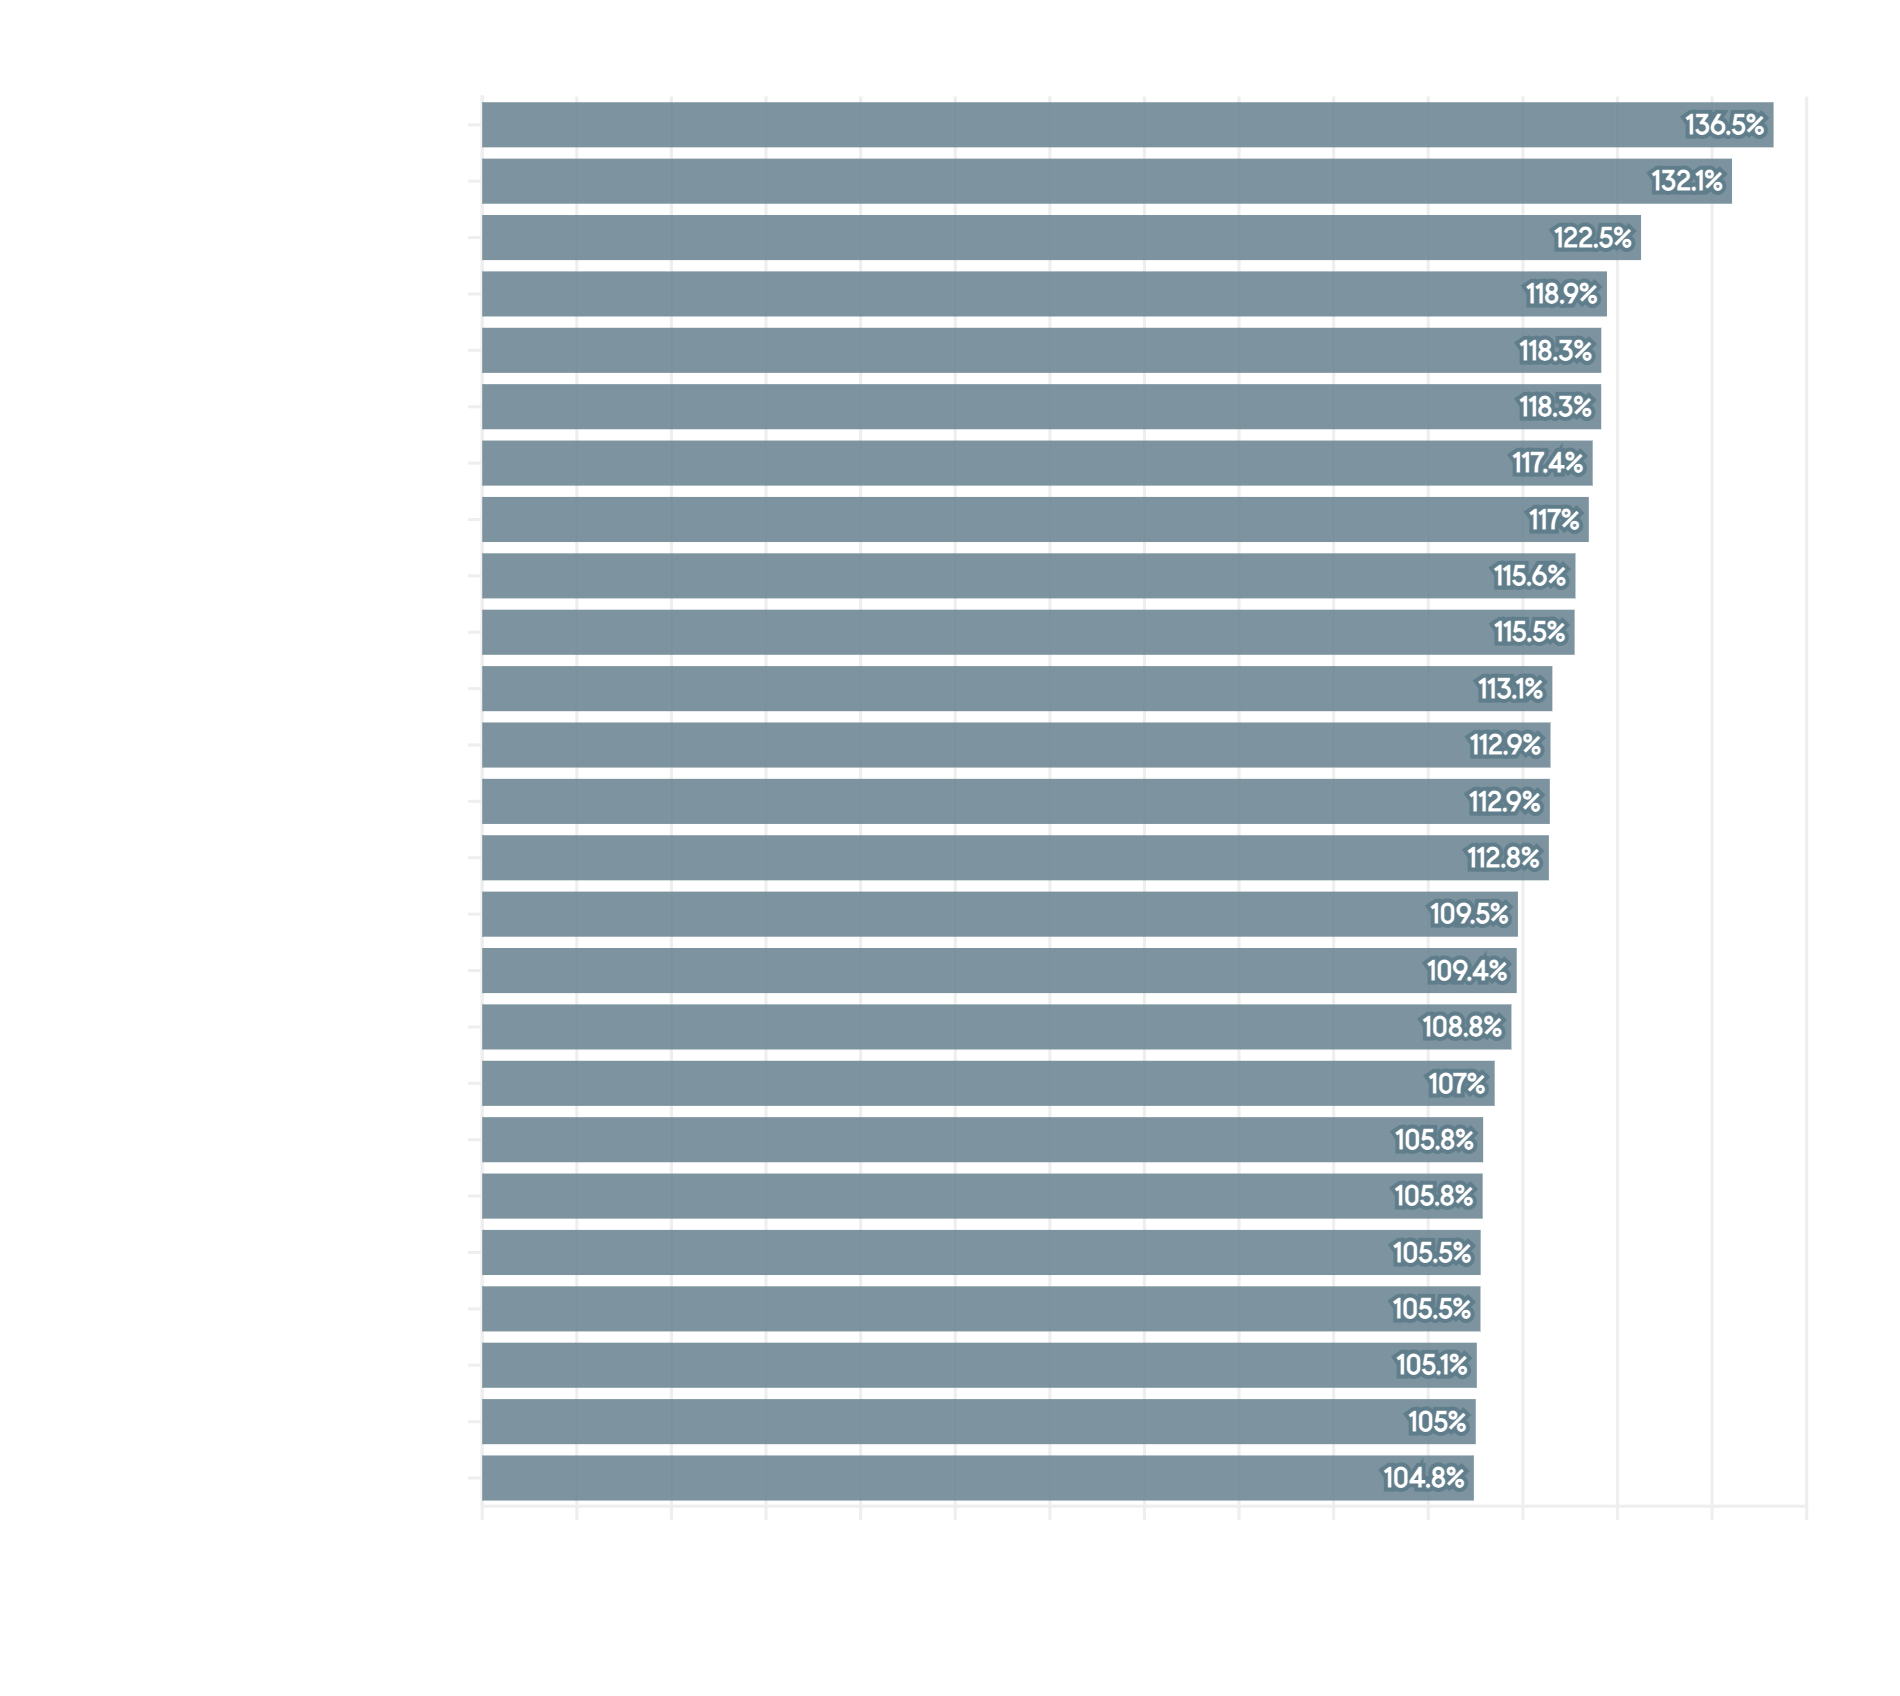
Inventory remains constrained, helping drive strong competition across many neighborhoods as the average single-family home sale-to-list price ratio climbed to approximately 125% in April.
Average days on market for single-family homes remained notably low at roughly 17 days, underscoring the pace and intensity we are seeing across the city.
At the same time, the luxury segment continues to experience meaningful momentum, particularly in neighborhoods such as Cow Hollow, Sea Cliff, Presidio Heights, Russian Hill, and Noe Valley, where pricing and buyer activity remain exceptionally strong. Median house prices in several top-tier neighborhoods surpassed $8M-$9M+, while prime areas across both the house and condo markets continued to command some of the city's highest price-per-square-foot values.
Broader economic conditions have also recently shifted in a favorable direction. Following announcements of ceasefires in Iran and Lebanon, and confirmation that the Strait of Hormuz remains open, key financial indicators have improved, though the geopolitical landscape remains fluid. As of late May, mortgage rates have eased to approximately 6.3%, while stock markets have rebounded sharply, reaching new all-time highs.
This combination of improving financial conditions and constrained supply continues to support a highly competitive and opportunity-rich environment for both buyers and sellers as we move deeper into the spring season.
With an anticipated $3 trillion in Al-driven IPO capital expected to enter the market this year, the San Francisco real estate landscape shows no signs of slowing down.
Warmly,
Faye
|
|
|
|
|
|
|
San Francisco House Prices
|
|
Historical County Median Sale Price Trends
|
|
|
|
|
|
|
|
|
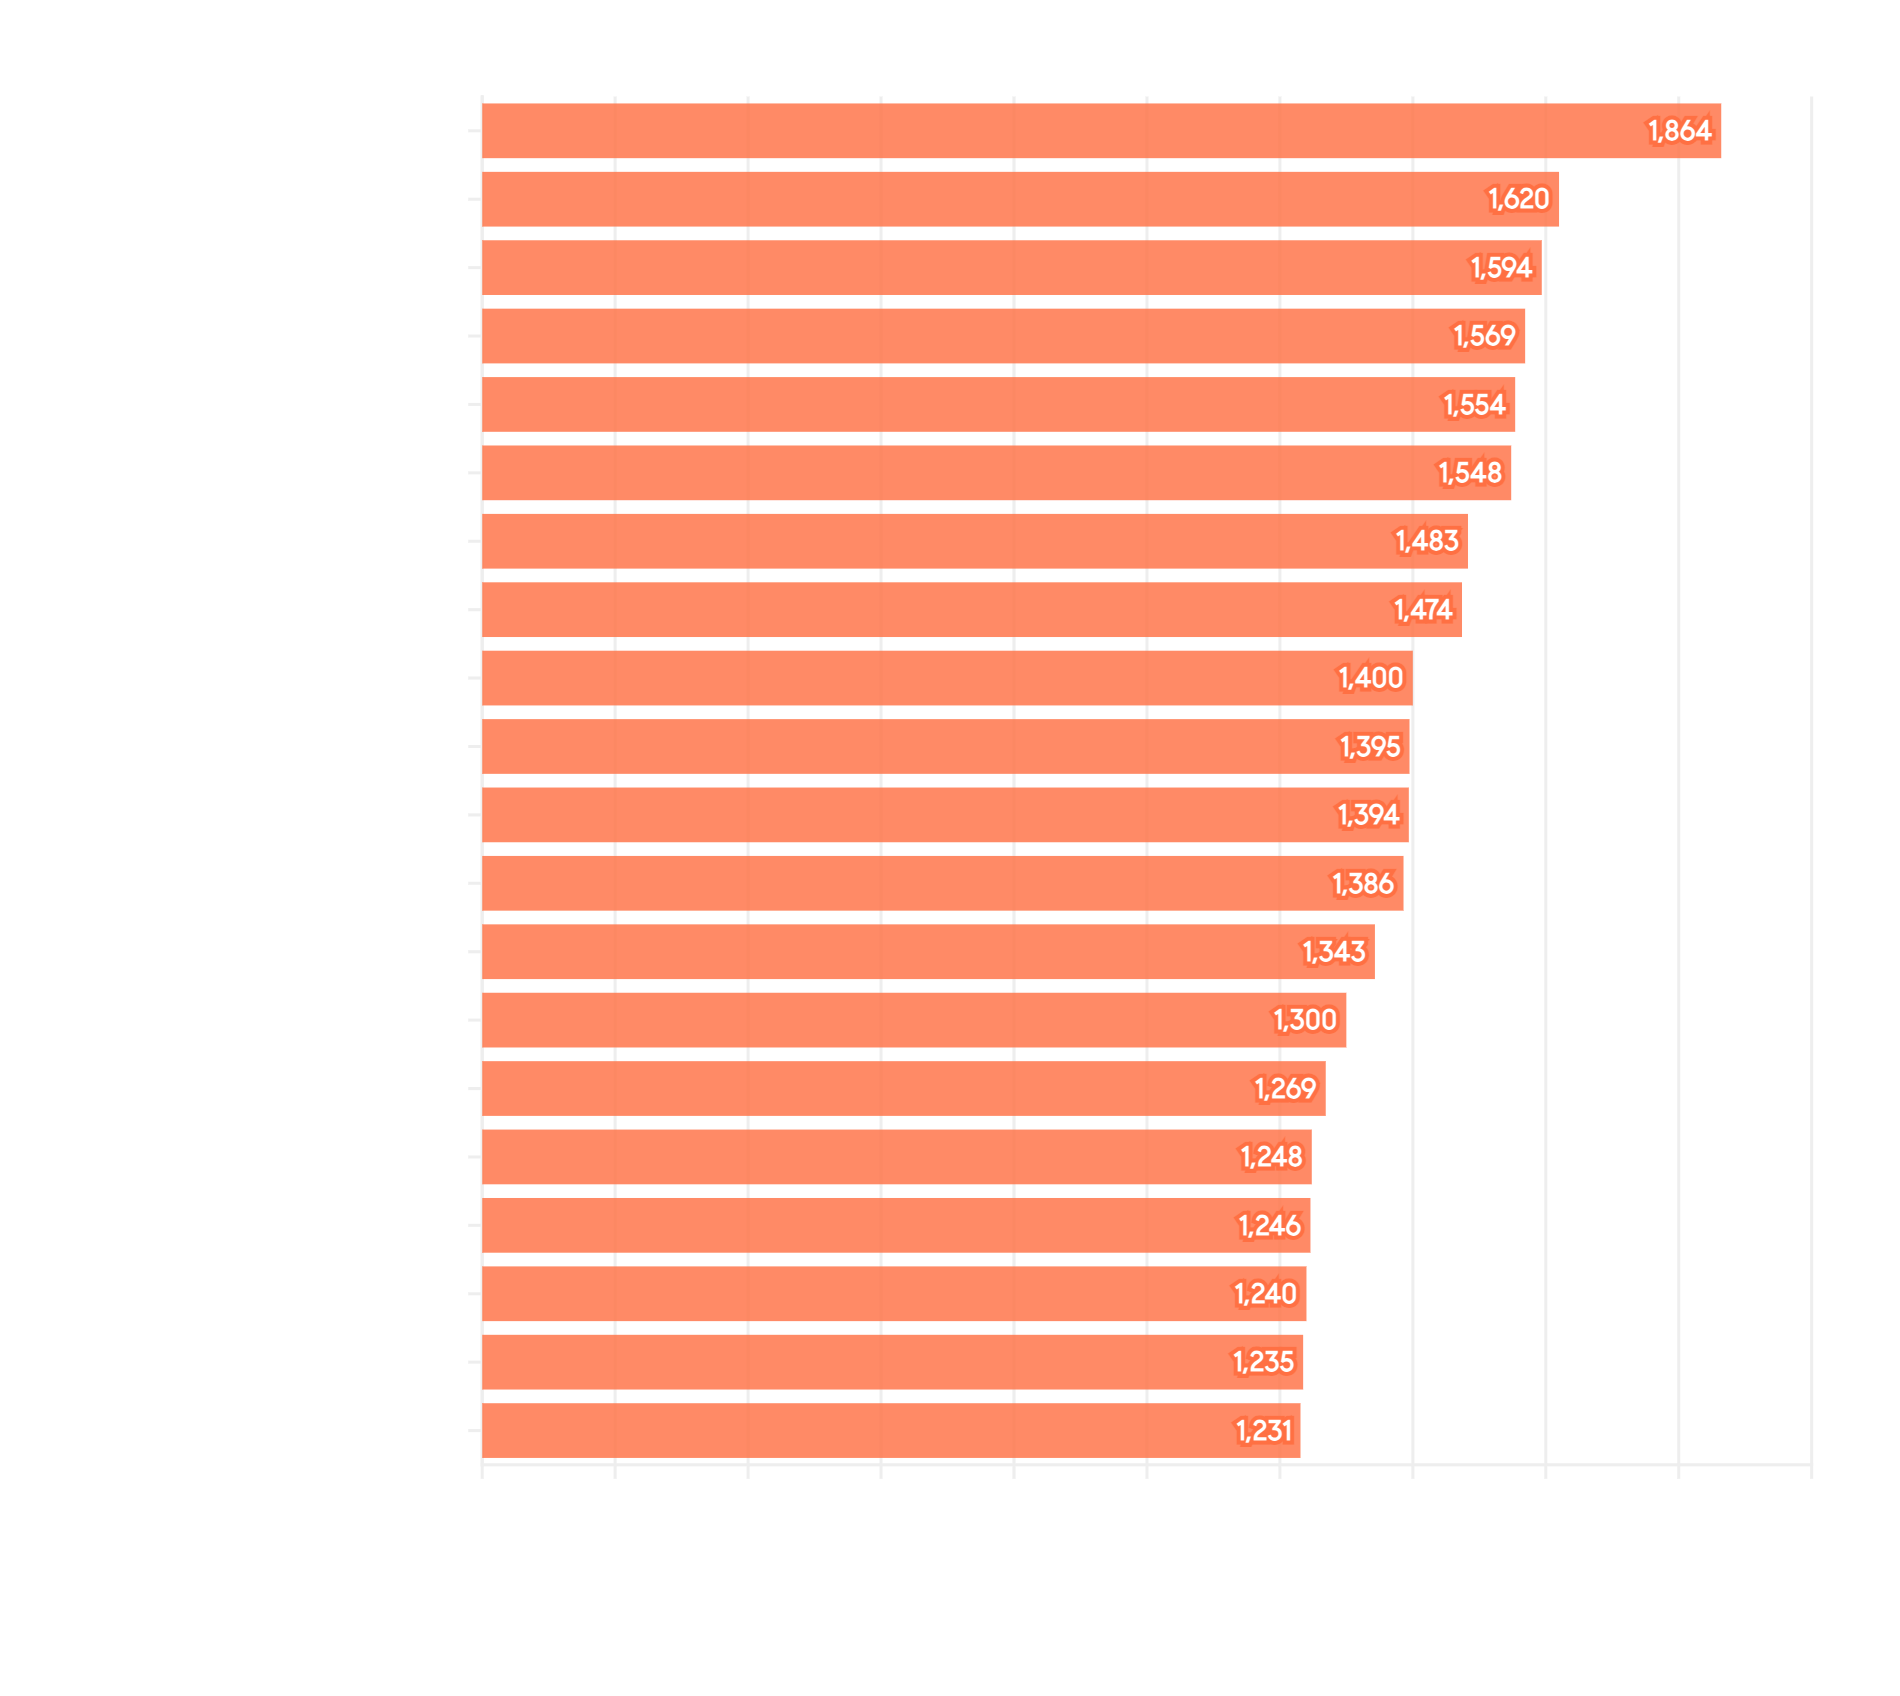
Many factors affect home values: architectural style, quality of construction, square footage, condition, amenities, light, views, privacy, outdoor space, “bonus” rooms, additional parking, quality of location within the neighborhood, and so on.
|
|
|
|
|
|
|
San Francisco Median PPSF
|
|
Historical County Median Sale Price Trends
|
|
|
|
|
|
|
|
|
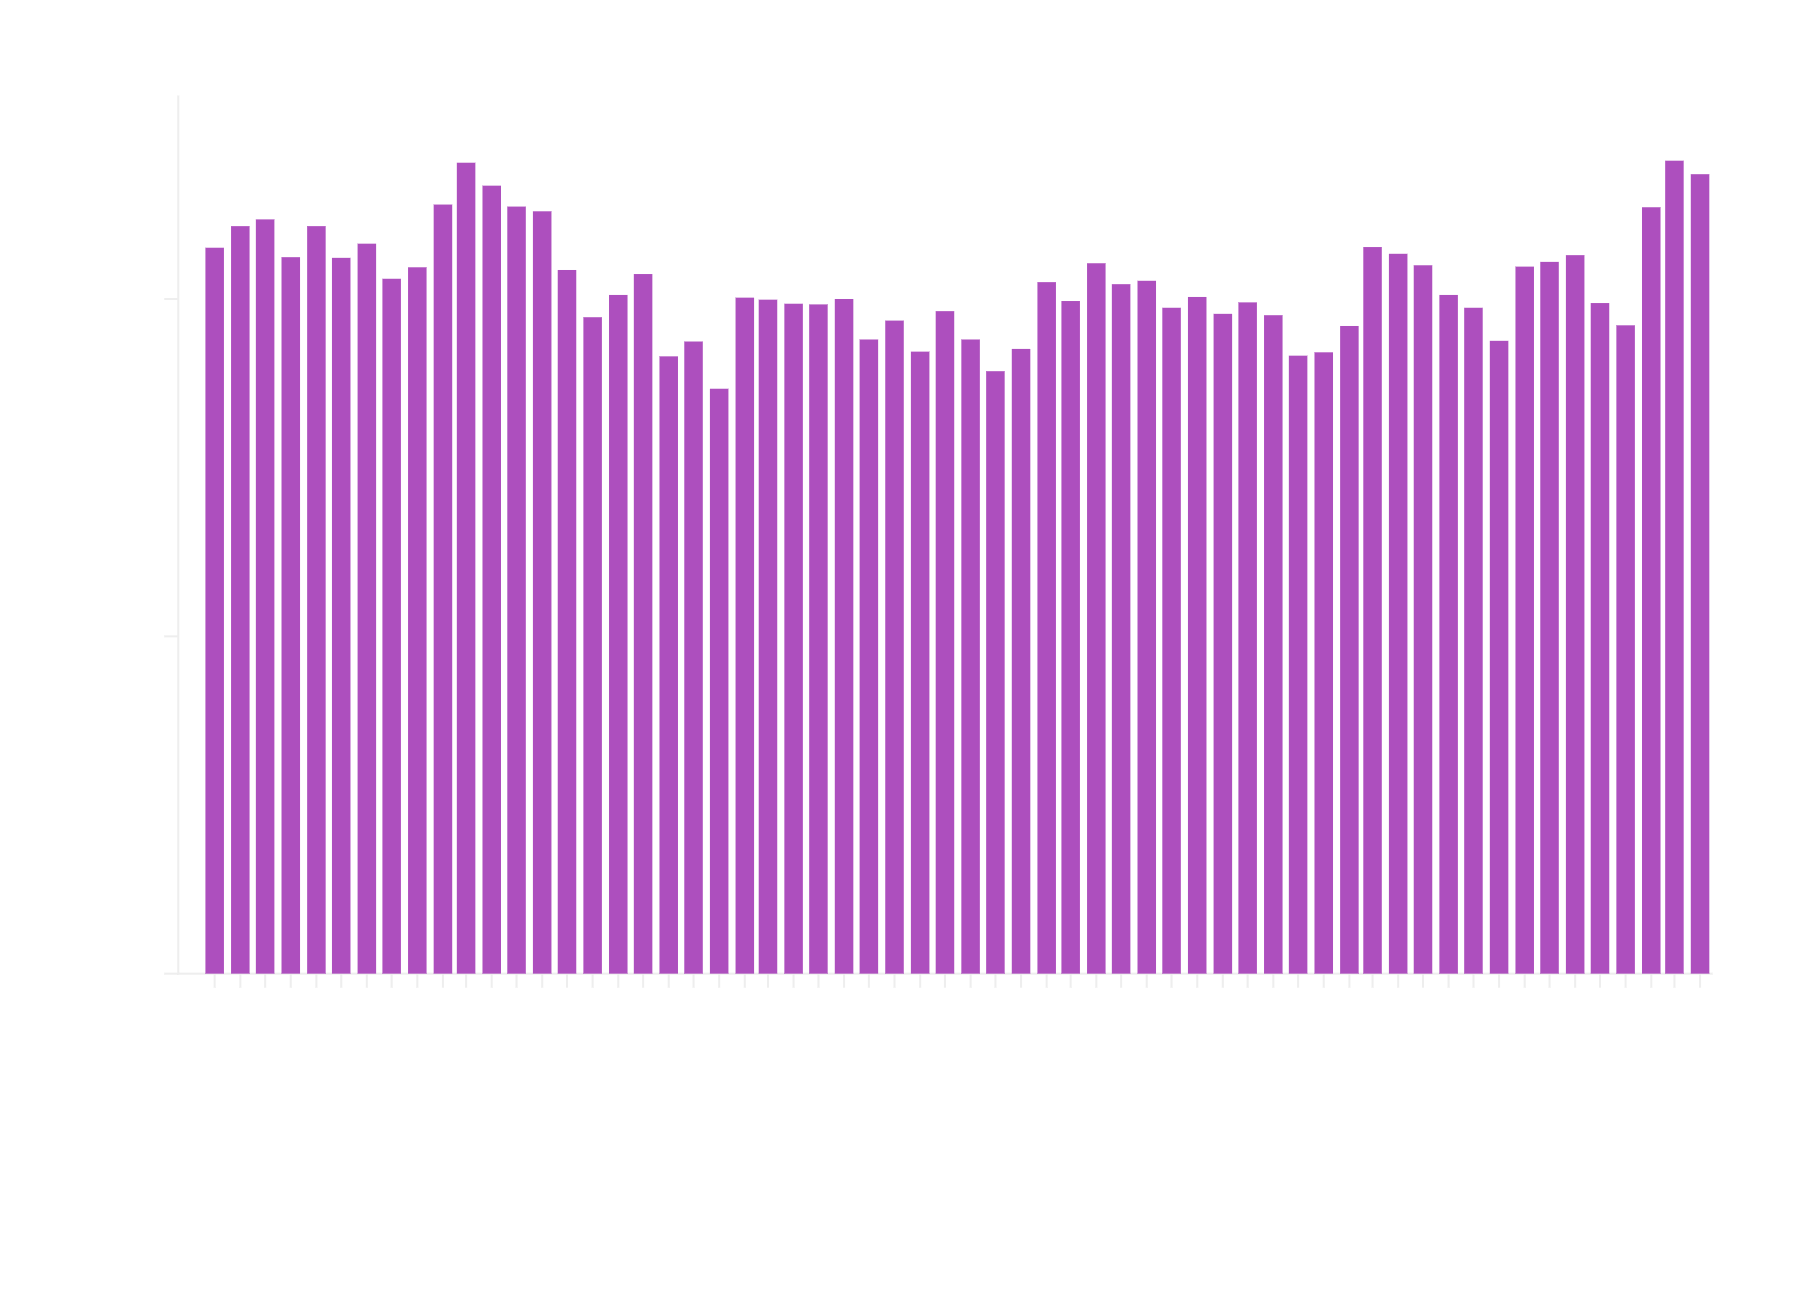
The calculation of dollar per square foot is based on interior living space and doesn’t include garages, attics, basements, rooms built without permit, decks, patios or lot size (though all these can add value to the home).
|
|
|
|
|
|
|
|
|
Historical County Sale Trends
|
|
|
|
|
|
|
|
|
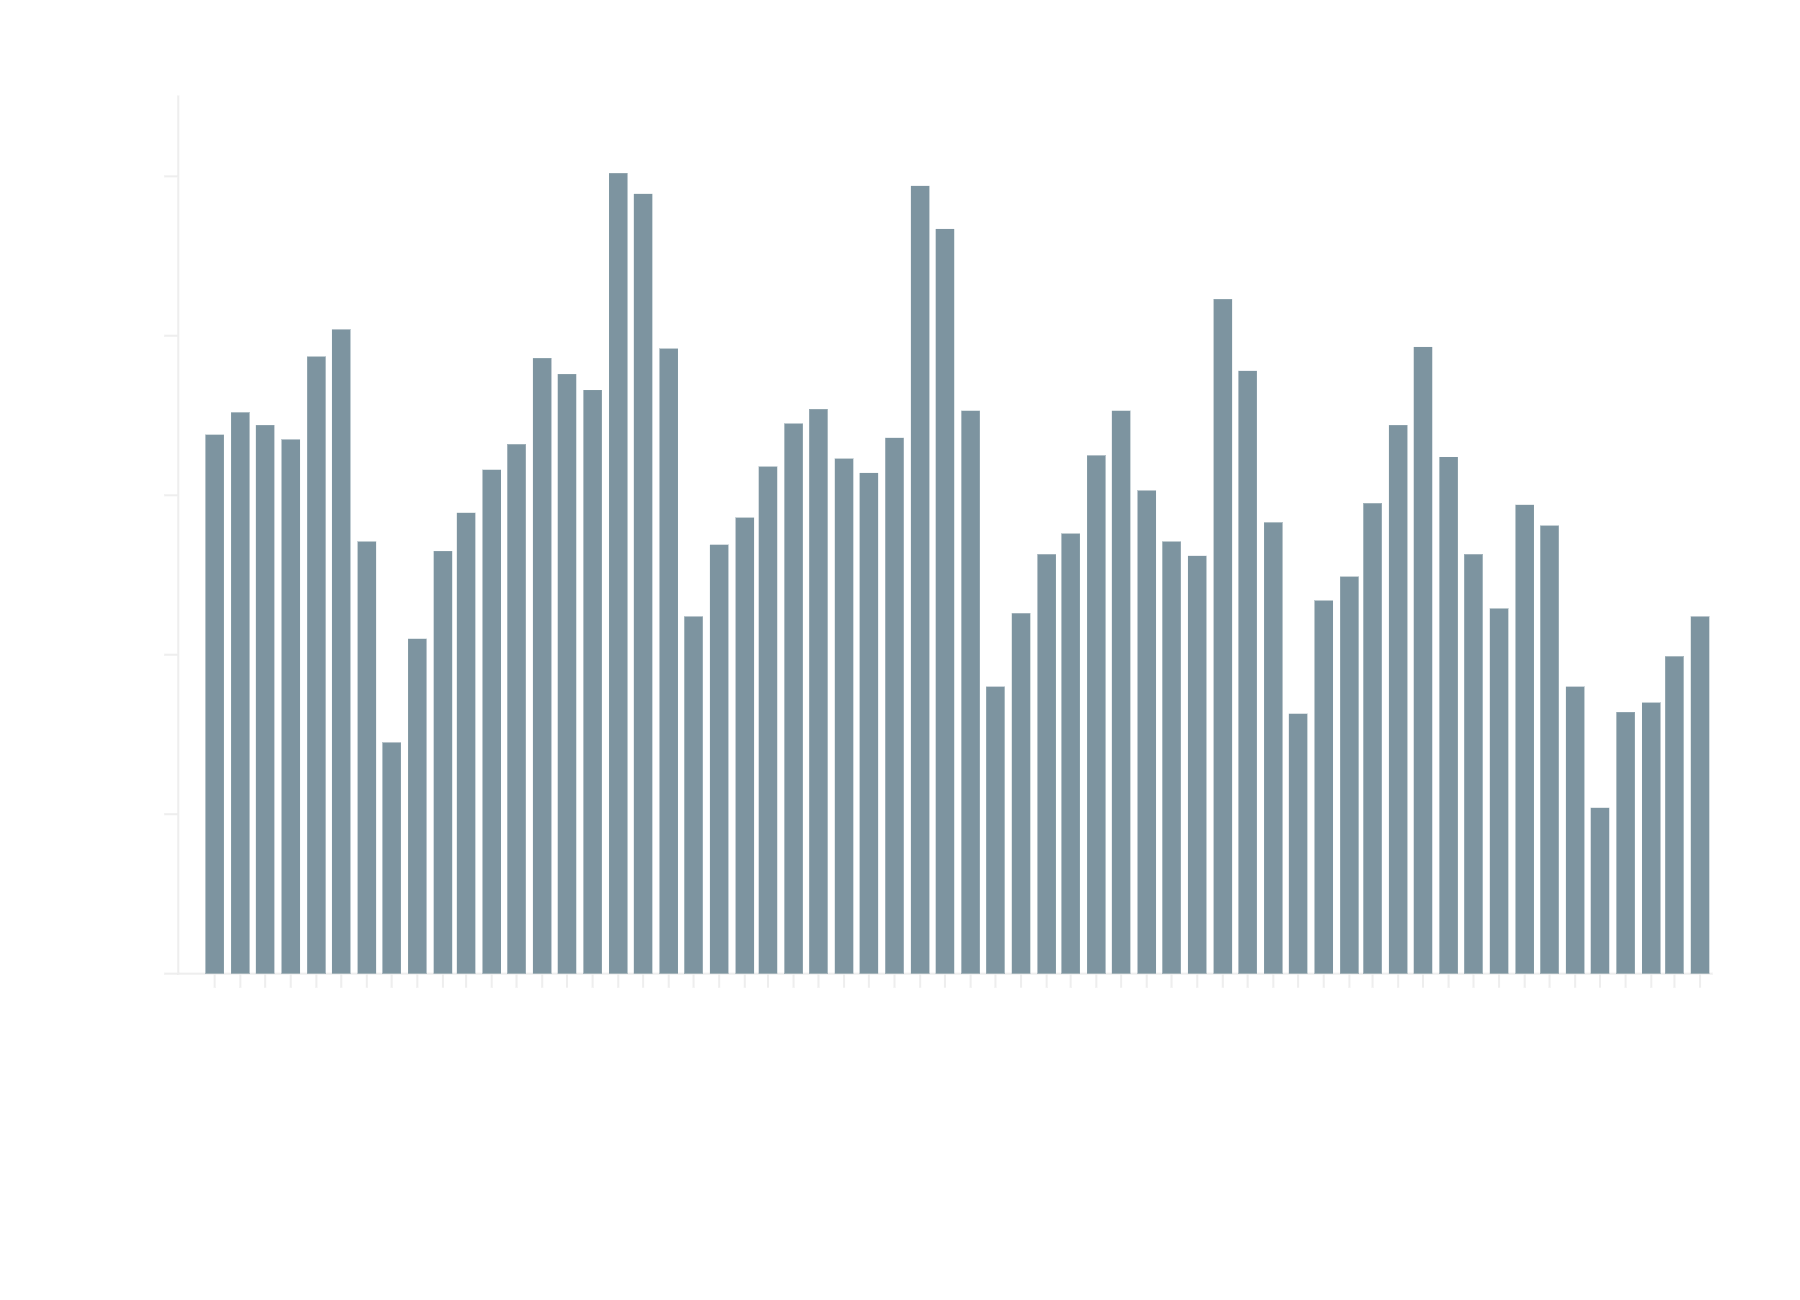
Closed sale trends reflect the number of completed real estate transactions over the past five years and provide insight into market activity, buyer demand, and overall housing market health across different time periods and seasonal patterns.
|
|
|
|
|
|
|
San Francisco New Listings
|
|
Historical County New Listing Trends
|
|
|
|
|
|
|
|
|
New listing trends reflect the number of properties entering the market over the past five years and provide insight into seller activity, inventory levels, and overall housing supply across different time periods and seasonal patterns.
|
|
|
|
|
|
|
|
|
Historical County Active Listing Trends
|
|
|
|
|
|
|
|
|
Active inventory trends reflect the number of properties available for sale at any given time over the past five years and provide insight into market supply, competitive conditions, and the balance between buyers and sellers across different time periods and seasonal patterns.
|
|
|
|
|
|
|
|
|
Historical County Days on Market Trends
|
|
|
|
|
|
|
|
|
Days on market trends reflect the median time properties remain listed before selling over the past five years and provide insight into market pace, buyer urgency, and whether conditions favor buyers or sellers across different time periods and seasonal patterns.
|
|
|
|
|
|
|
|
|
Historical County Sale to List Percentage Market Trends
|
|
|
|
|
|
|
|
|
Sold to list percentage trends reflect the ratio between final sale prices and original asking prices over the past five years and provide insight into market competitiveness, pricing accuracy, and whether conditions favor buyers or sellers across different time periods and seasonal patterns.
|
|
|
|
|
|
|
San Francisco House Prices
|
|
April Median HOUSE Sales Prices
Selected Neighborhoods
|
|
|
|
|
|
|
|
|
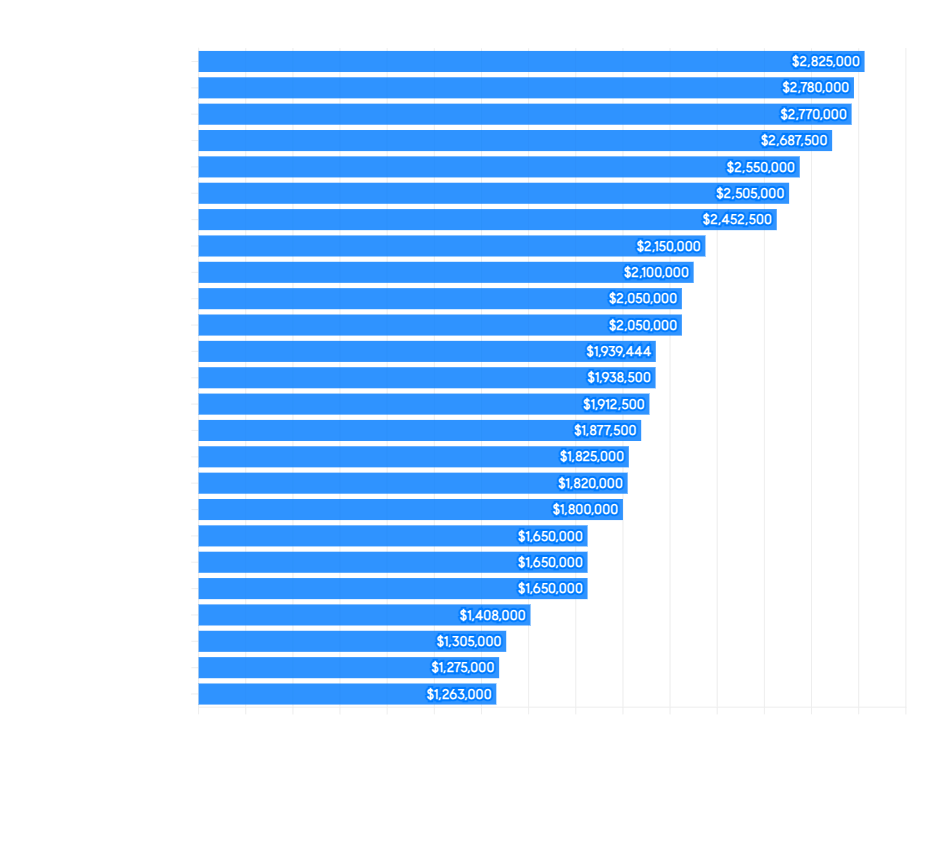
Many factors affect home values: architectural style, quality of construction, square footage, condition, amenities, light, views, privacy, outdoor space, “bonus” rooms, additional parking, quality of location within the neighborhood, and so on.
|
|
|
|
|
|
|
San Francisco Median PPSF
|
|
April Median HOUSE $/Sq.Ft. Values
Selected Neighborhoods
|
|
|
|
|
|
|
|
|
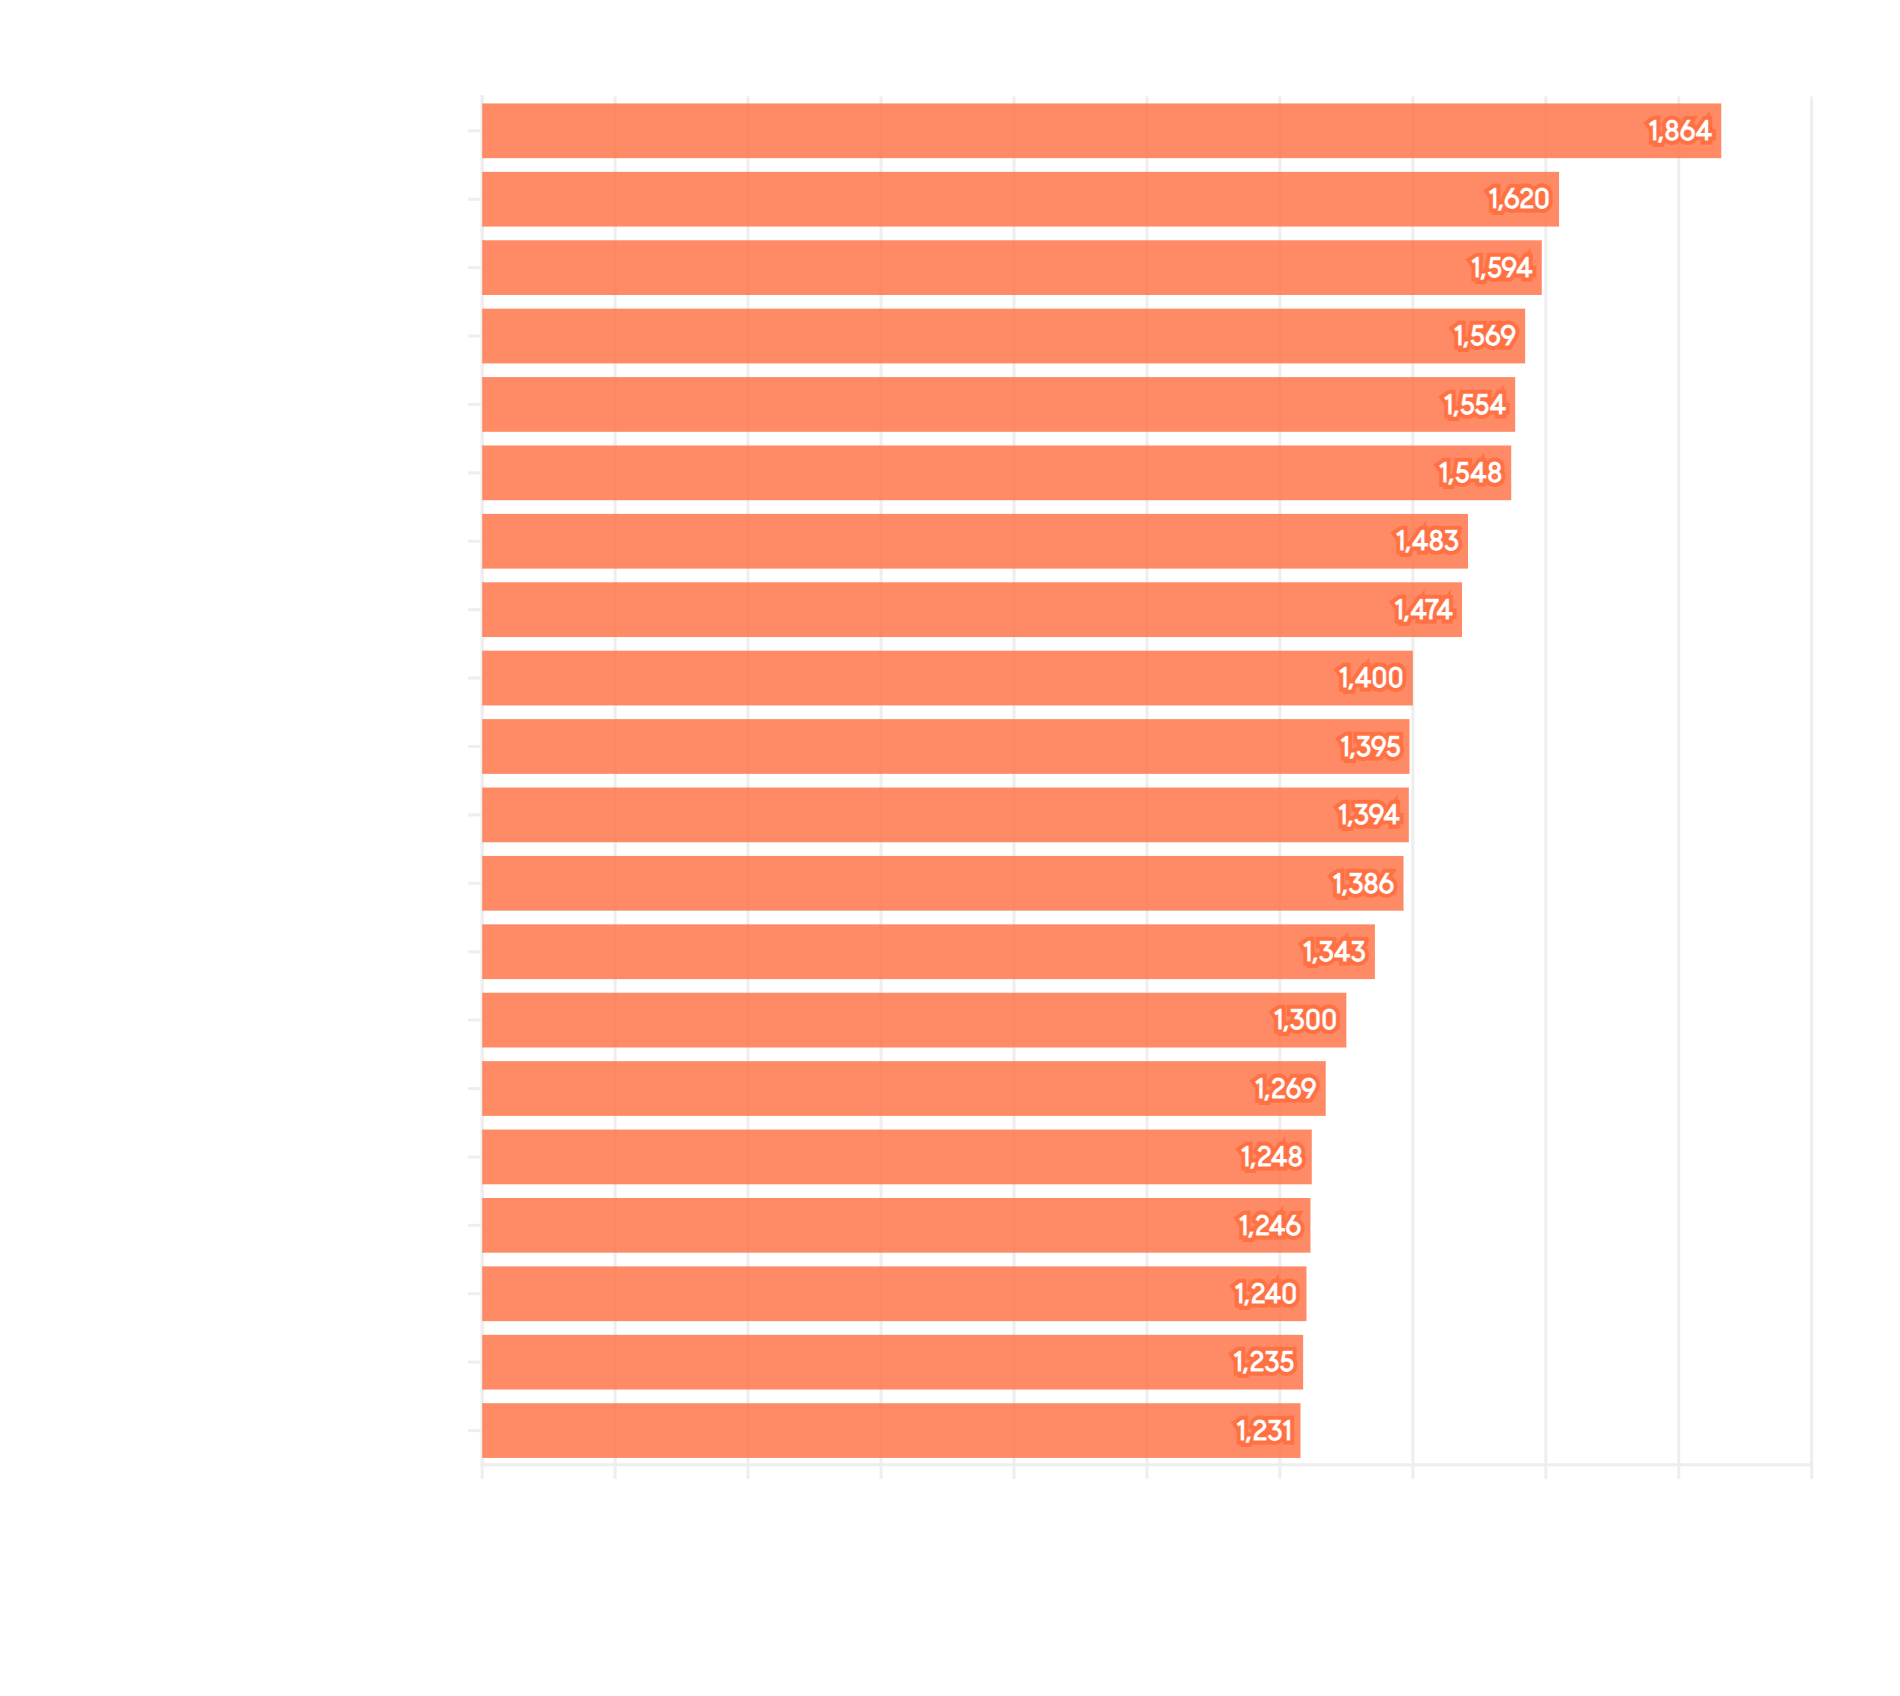
The calculation of dollar per square foot is based on interior living space and doesn’t include garages, attics, basements, rooms built without permit, decks, patios or lot size (though all these can add value to the home).
|
|
|
|
|
|
|
San Francisco Median SQFT
|
|
April Median HOUSE Square Footage
Selected Neighborhoods
|
|
|
|
|
|
|
|
|
Many factors affect home values: architectural style, quality of construction, square footage, condition, amenities, light, views, privacy, outdoor space, “bonus” rooms, additional parking, quality of location within the neighborhood, and so on.
|
|
|
|
|
|
|
San Francisco Neighborhoods with Most House Sales
|
|
San Francisco’s Largest HOUSE Markets in April
|
|
|
|
|
|
|
|
|
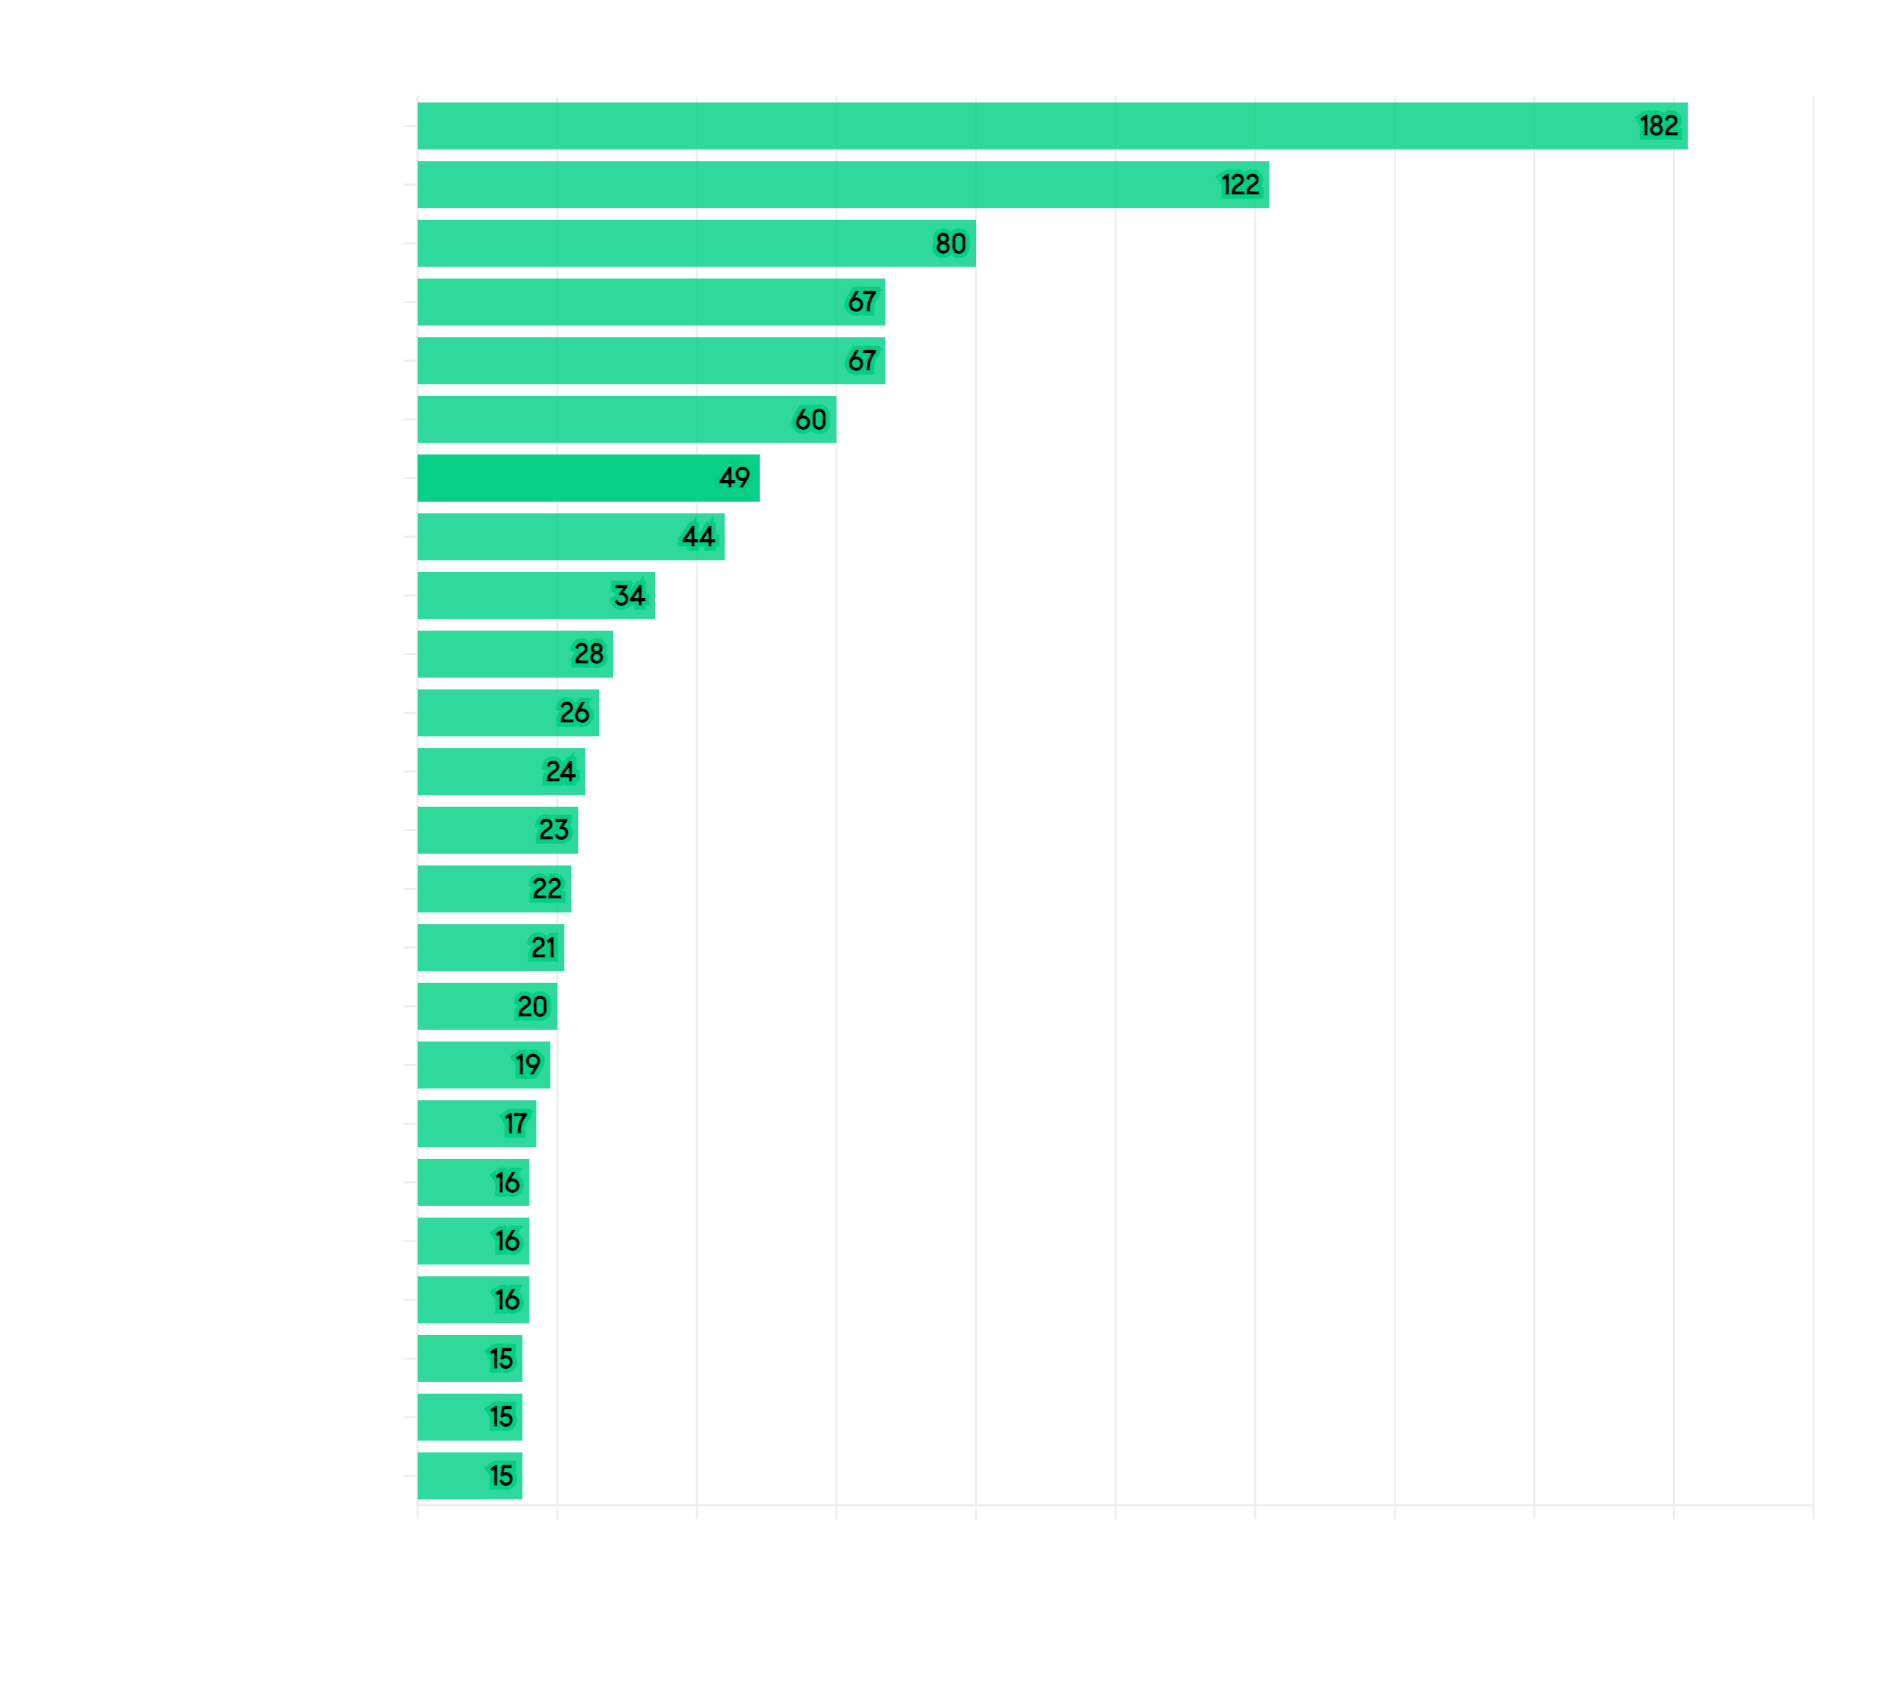
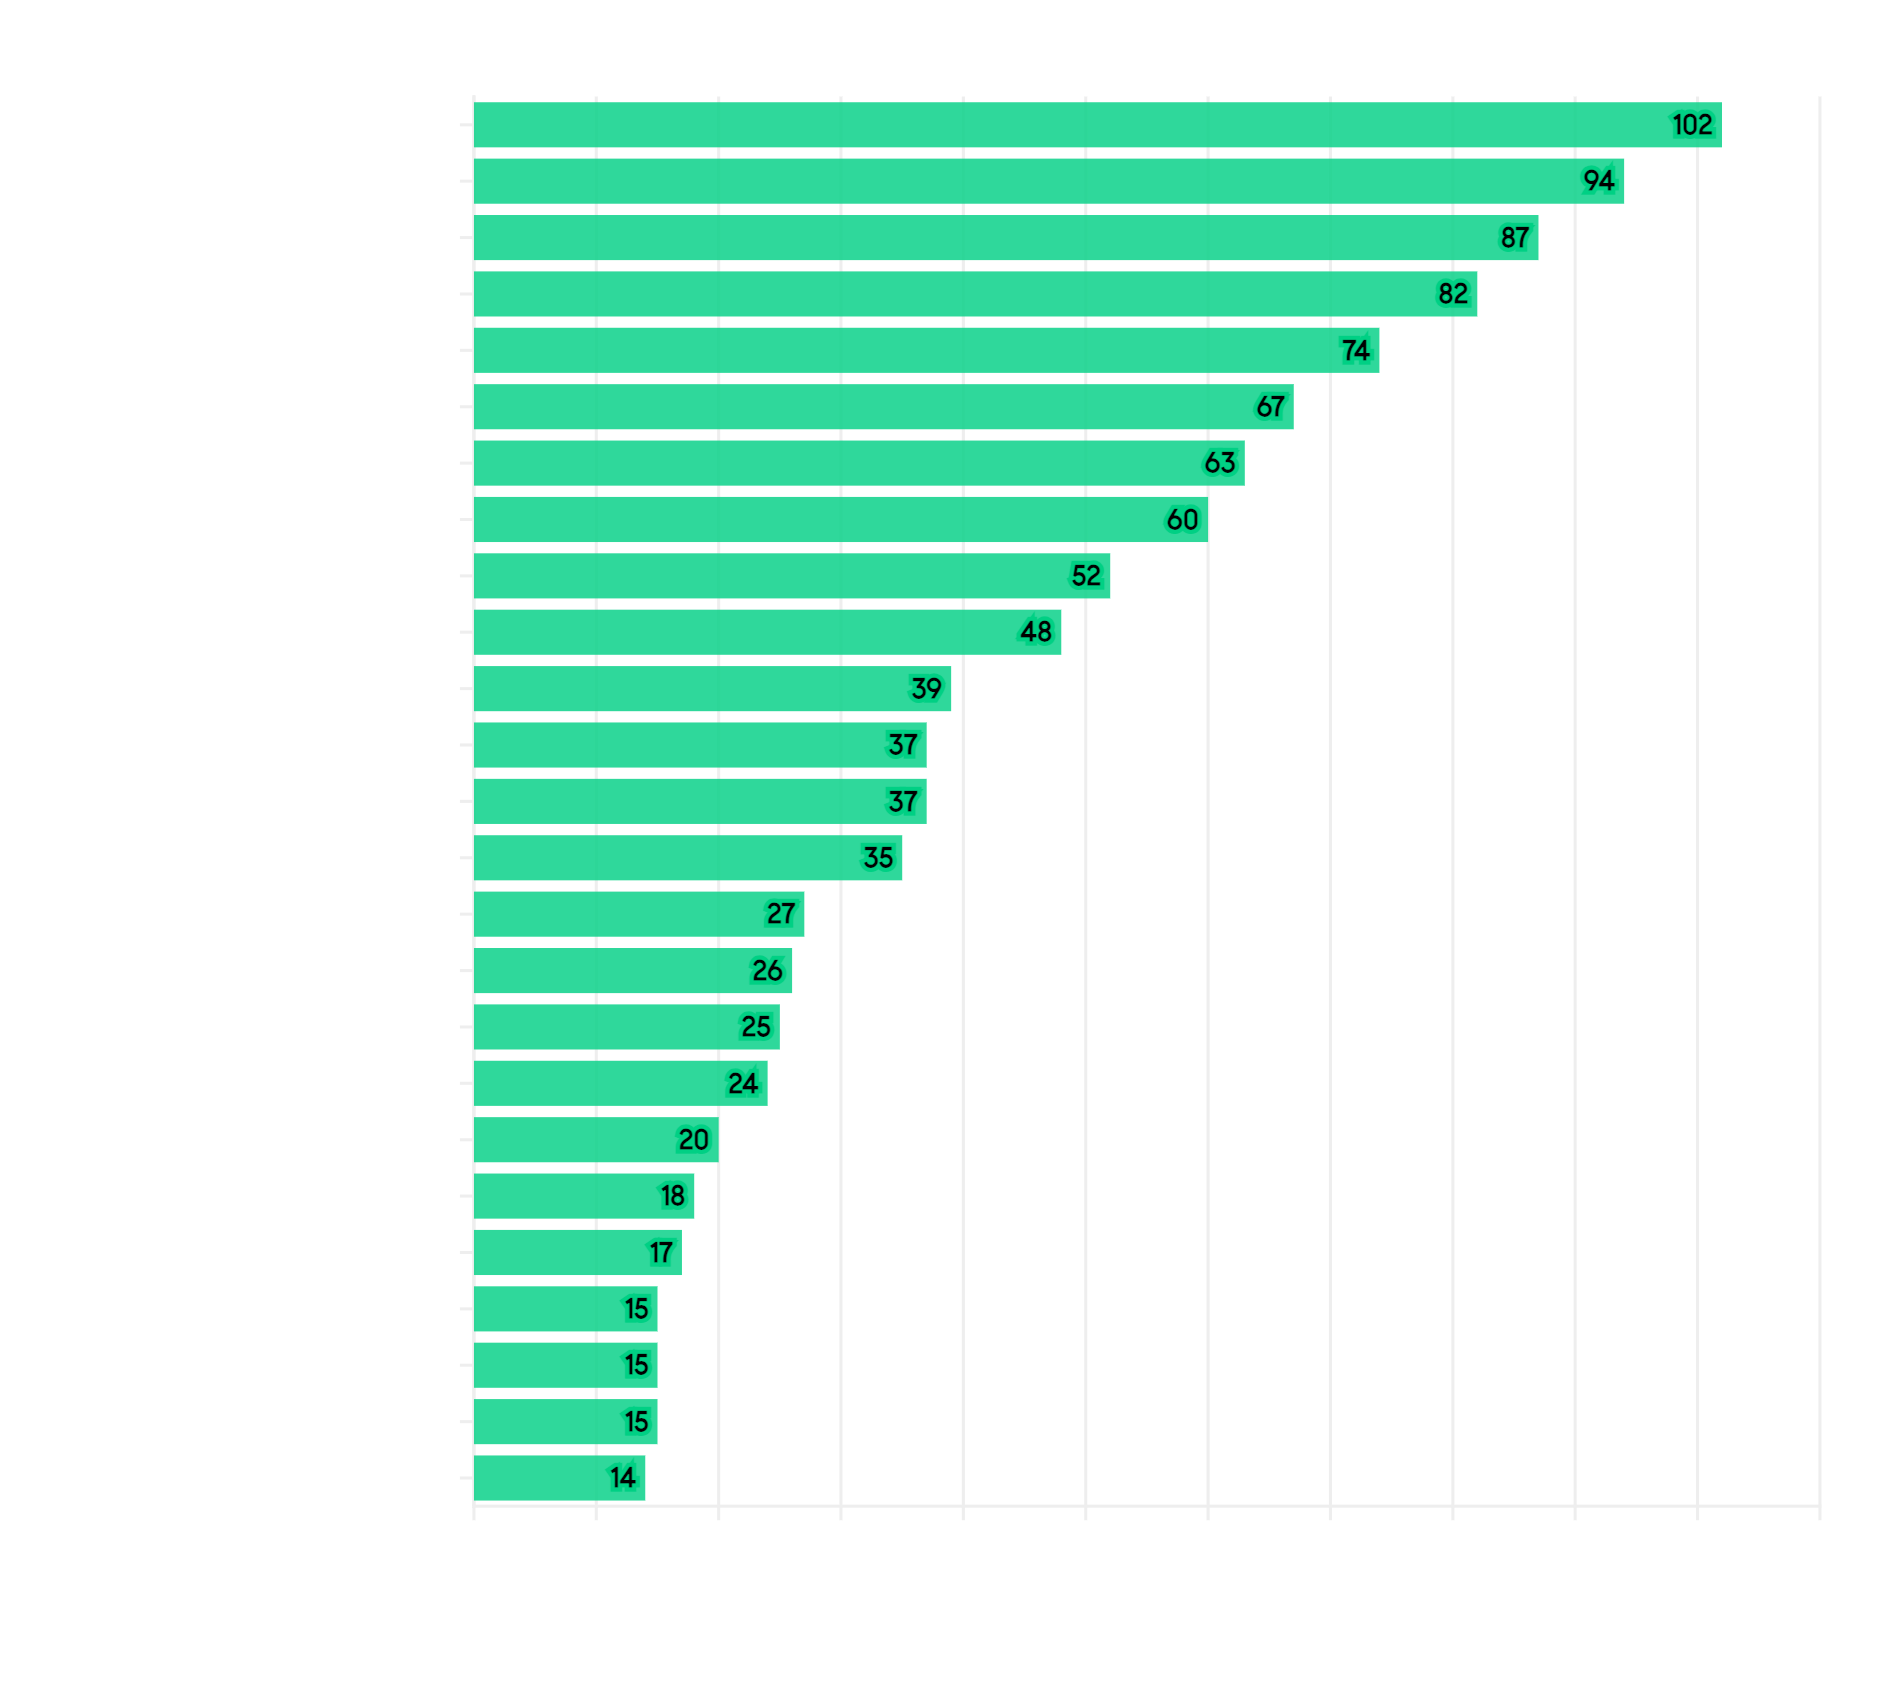
Many factors affect home values: architectural style, quality of construction, square footage, condition, amenities, light, views, privacy, outdoor space, “bonus” rooms, additional parking, quality of location within the neighborhood, and so on.
|
|
|
|
|
|
|
San Francisco Days on Market
|
|
Average Days on Market to Acceptance of Offer in April
|
|
|
|
|
|
|
|
|
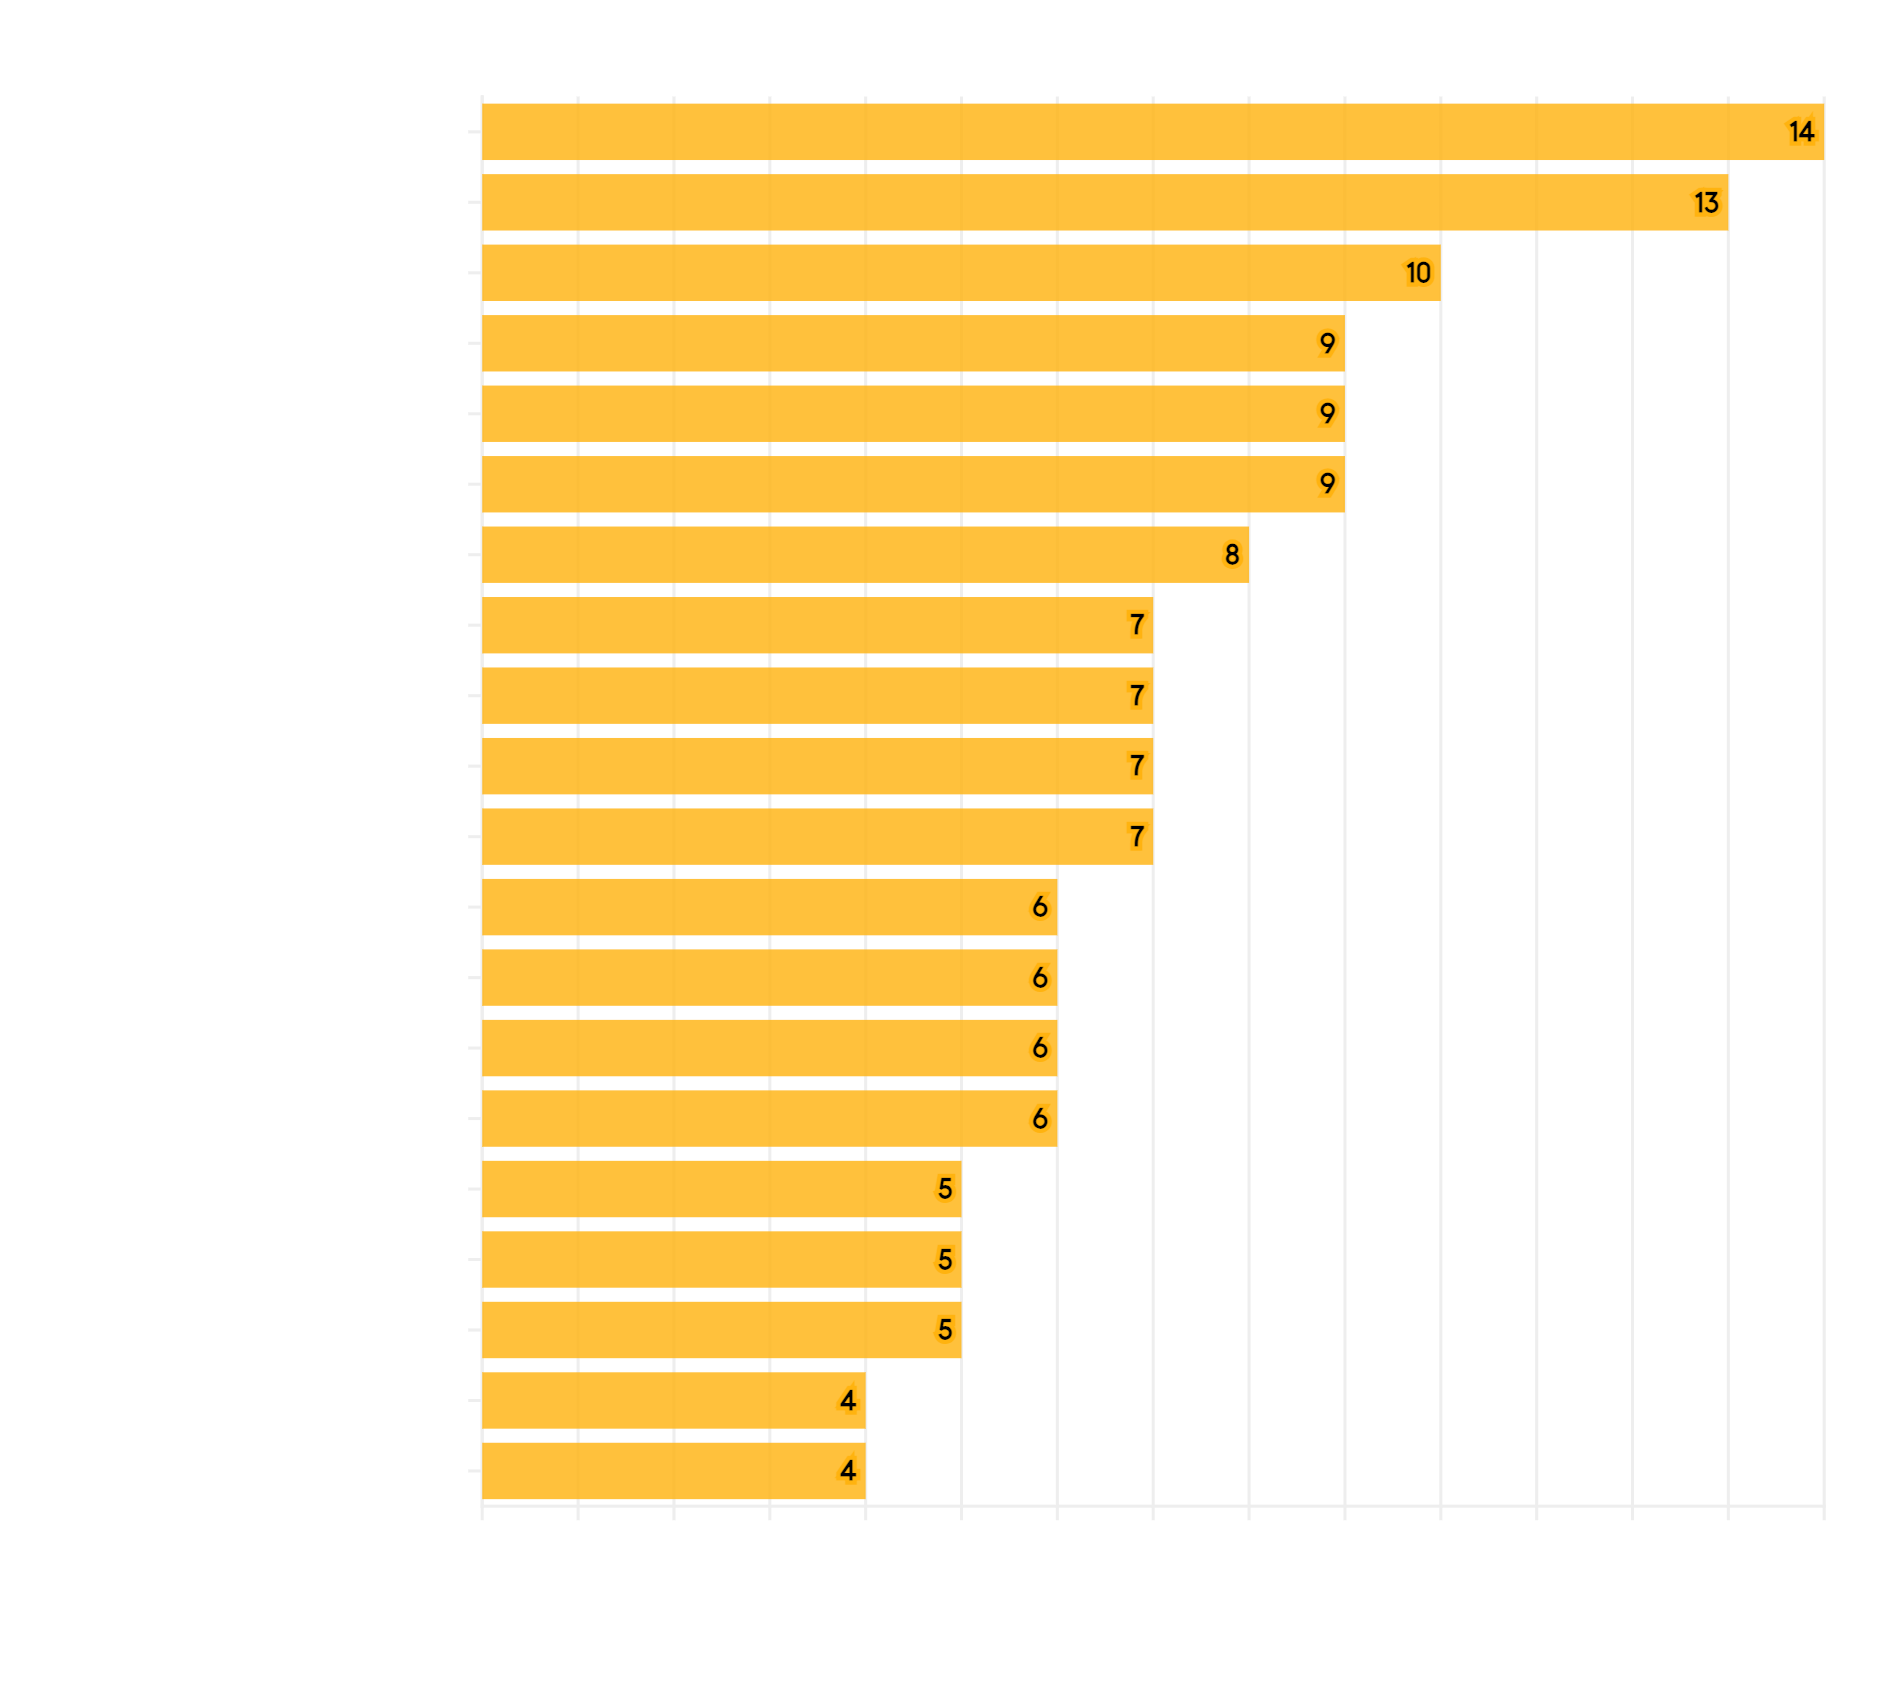
Lower days-on-market generally signify stronger buyer demand. It is not unusual for more expensive markets to have higher days-on-market readings, though this is not always the case.
|
|
|
|
|
|
|
|
|
Percentage of Listings Selling Over List Price in April
|
|
|
|
|
|
|
|
|
Higher percentages of sales over list price typically signify greater buyer competition for new listings, but this statistic can be distorted by strategic underpricing strategies by sellers and listing agents.
|
|
|
|
|
|
|
San Francisco Condo Prices
|
|
April Median Condo Sales Prices
Selected Neighborhoods
|
|
|
|
|
|
|
|
|
Many factors affect home values: architectural style, quality of construction, square footage, condition, amenities, light, views, privacy, outdoor space, “bonus” rooms, additional parking, quality of location within the neighborhood, and so on.
|
|
|
|
|
|
|
San Francisco Condo Prices
|
|
April Median Condo Sales Prices
Selected Neighborhoods
|
|
|
|
|
|
|
|
|
Many factors affect home values: architectural style, quality of construction, square footage, condition, amenities, light, views, privacy, outdoor space, “bonus” rooms, additional parking, quality of location within the neighborhood, and so on.
|
|
|
|
|
|
|
|
|
April Median CONDO $/Sq.Ft. Values
Selected Neighborhoods
|
|
|
|
|
|
|
|
|
The calculation of dollar per square foot is based on interior living space and doesn’t include common areas, parking spaces, rooms built without permit, storage rooms, decks or patios. All things being equal, a smaller unit will typically sell for a higher dollar per square foot value, but the floor a unit is on – and its views – can play a large role in condo values.
|
|
|
|
|
|
|
|
|
April Median CONDO $/Sq.Ft. Values
Selected Neighborhoods
|
|
|
|
|
|
|
|
|
The calculation of dollar per square foot is based on interior living space and doesn’t include common areas, parking spaces, rooms built without permit, storage rooms, decks or patios. All things being equal, a smaller unit will typically sell for a higher dollar per square foot value, but the floor a unit is on – and its views – can play a large role in condo values.
|
|
|
|
|
|
|
|
|
April Median CONDO Square Footage
Selected Neighborhoods
|
|
|
|
|
|
|
|
|
Comparing median sales prices between neighborhoods is not apples to apples, since the median size of units (as well as many other characteristics) vary so widely. The median condo size for the entire city is 2 bedrooms, 2 baths, 1162 sq.ft.
Median unit size does not include storage, parking or outdoor space (deeded or not).
|
|
|
|
|
|
|
|
|
April Median CONDO Square Footage
Selected Neighborhoods
|
|
|
|
|
|
|
|
|
Comparing median sales prices between neighborhoods is not apples to apples, since the median size of units (as well as many other characteristics) vary so widely. The median condo size for the entire city is 2 bedrooms, 2 baths, 1162 sq.ft.
Median unit size does not include storage, parking or outdoor space (deeded or not).
|
|
|
|
|
|
|
San Francisco Top Condo Sales
|
|
April Median Condo Sales Prices
Selected Neighborhoods
|
|
|
|
|
|
|
|
|
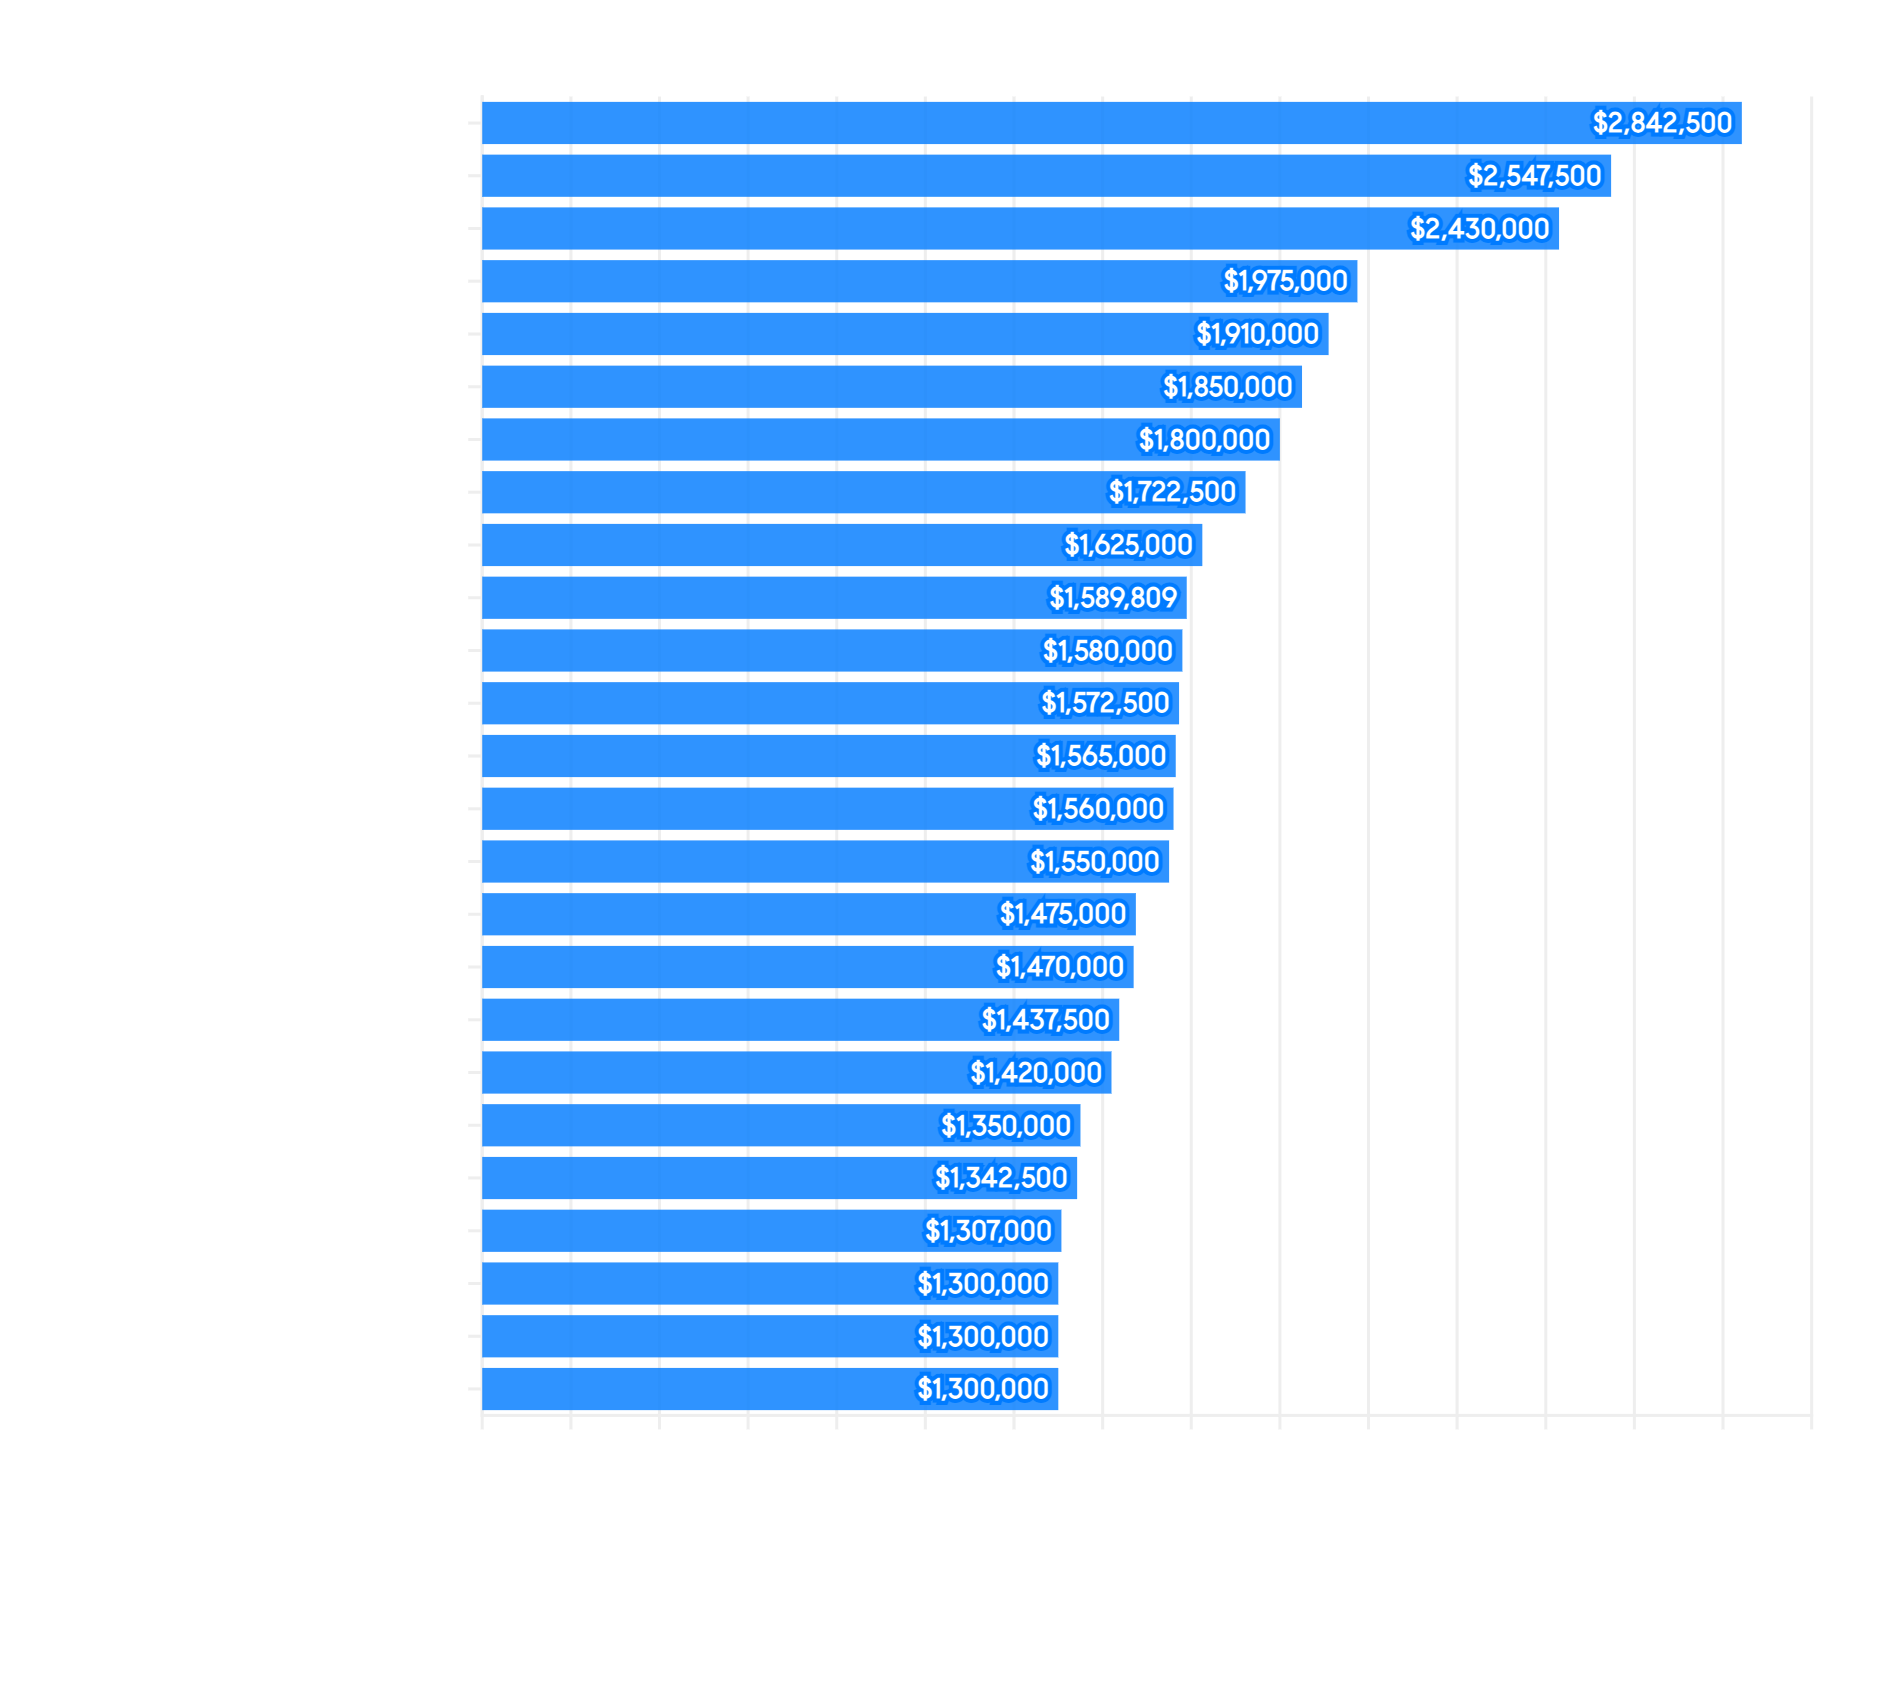
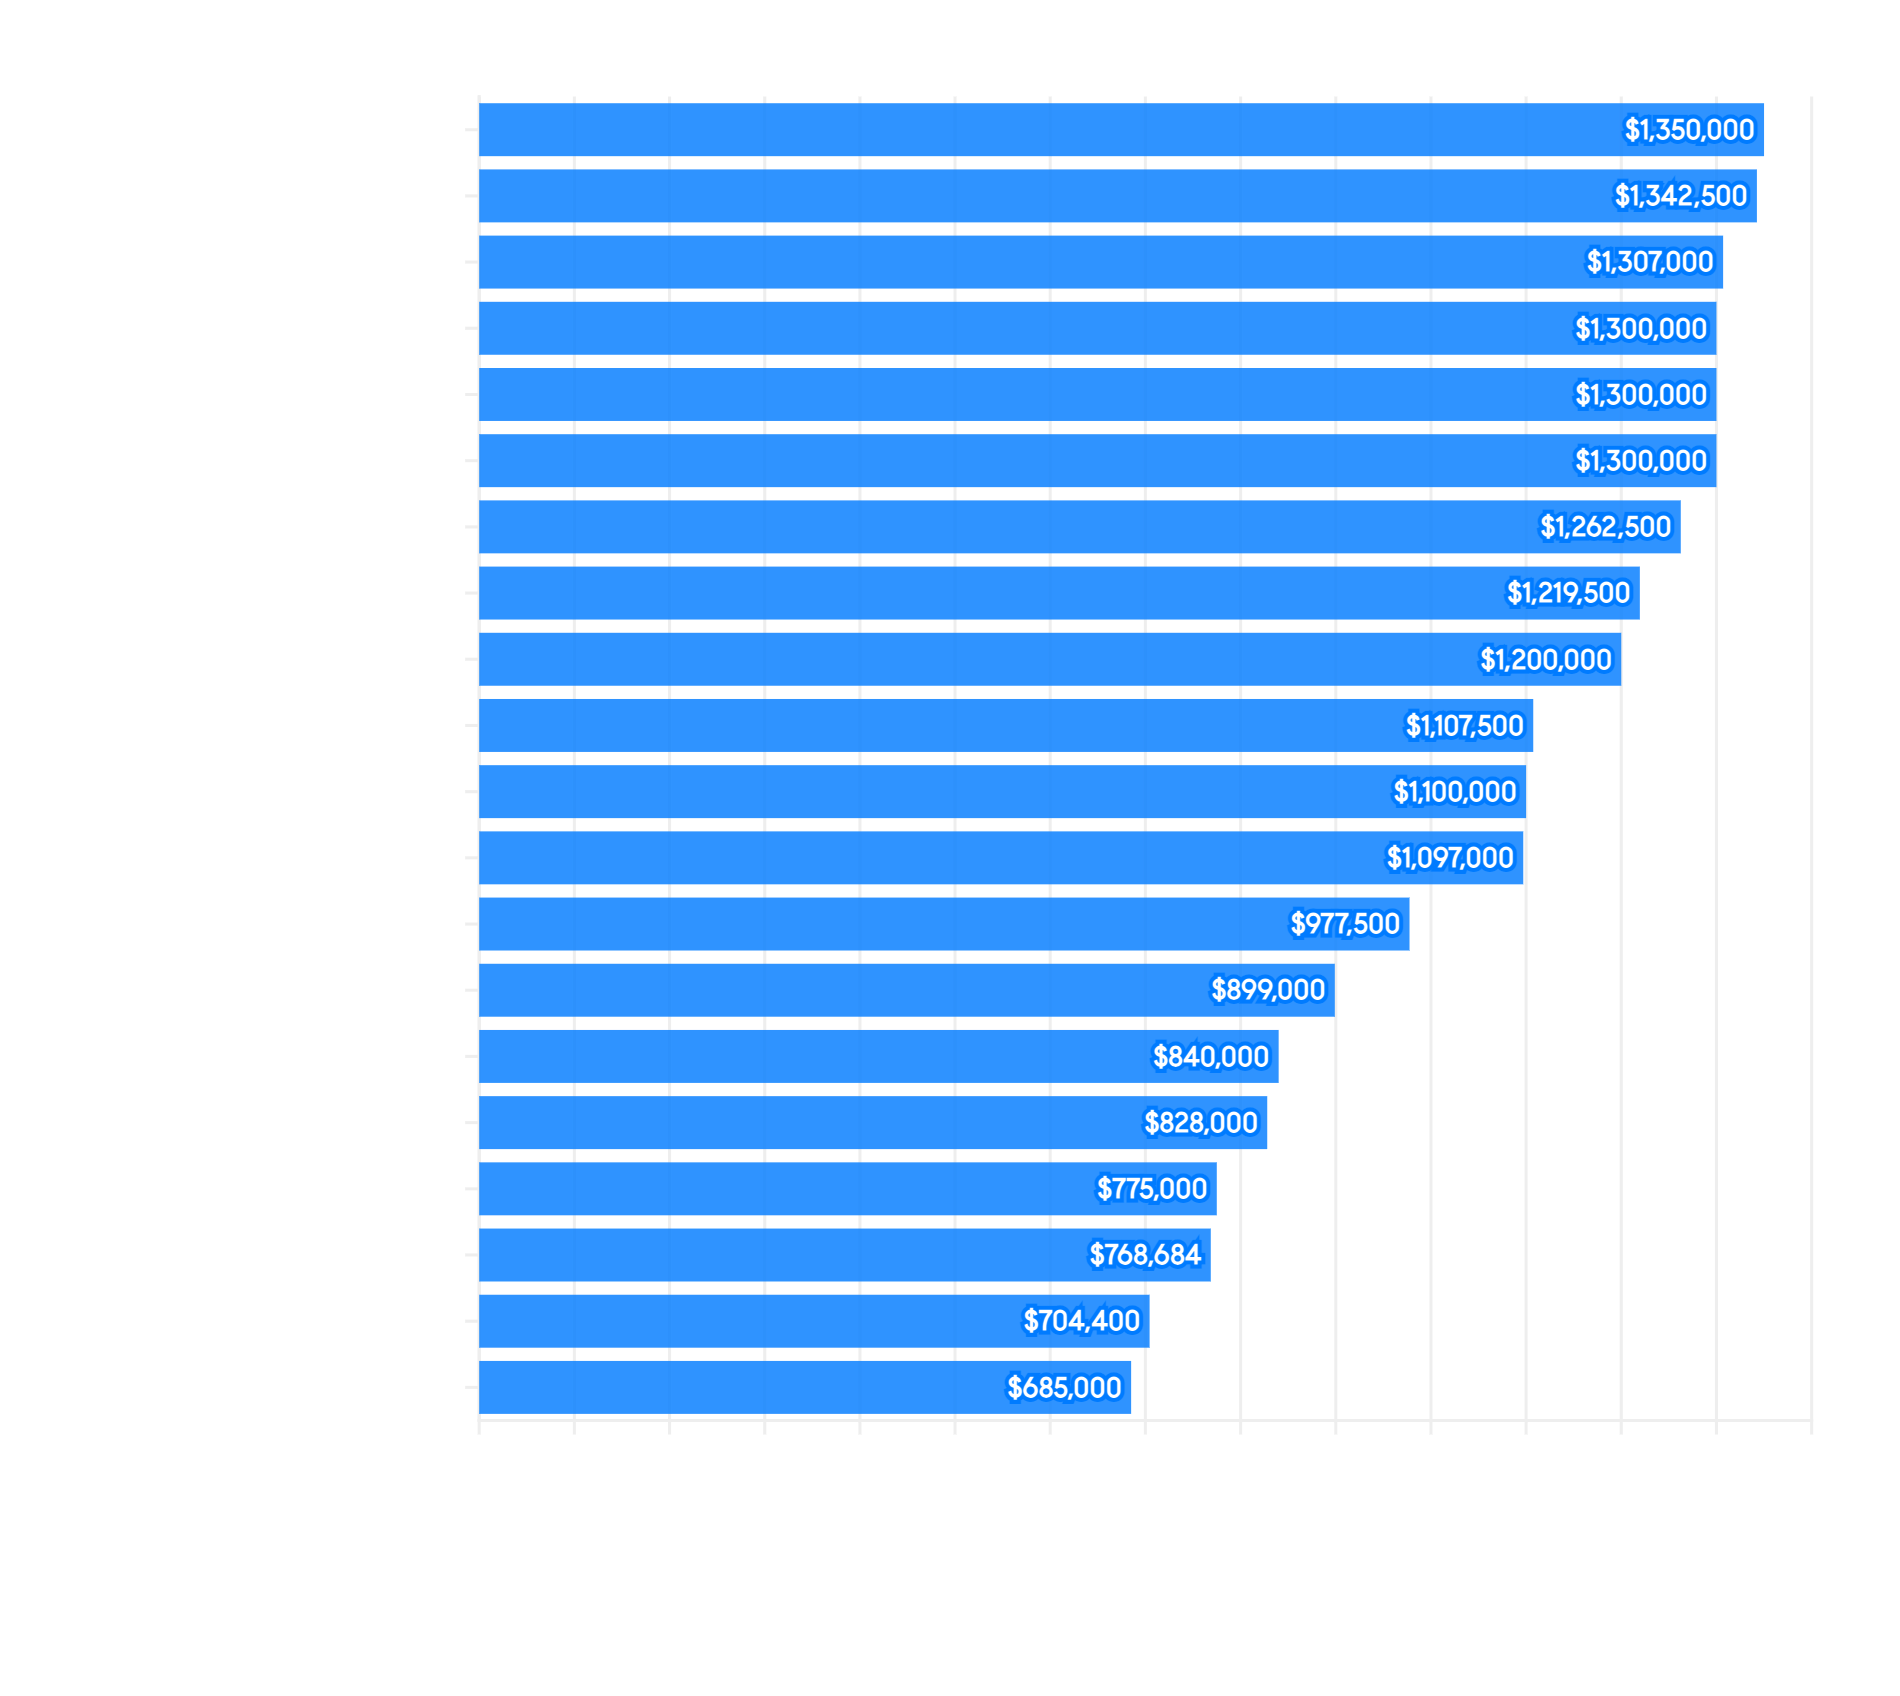
The character of condo buildings varies immensely between neighborhoods, from Victorian & Edwardian flats to towering, new high-rise projects – with many other styles built in between.
|
|
|
|
|
|
|
|
|
April Average Days on Market to Acceptance of Offer
|
|
|
|
|
|
|
|
|
Lower days-on-market generally signify stronger buyer demand, but there are various factors at play. Generally speaking, the house market has seen more heated dynamics than the city’s condo market, and thus lower days-on-market readings.
|
|
|
|
|
|
|
San Francisco Condo Sold/List%
|
|
April Percentage of Listings Selling Over List Price
|
|
|
|
|
|
|
|
|
Higher percentages of sales over list price typically signify more heated markets and greater buyer competition for new listings.
|
|
|
|
|
|
|
|
|
|
|
Compass is a real estate broker licensed by the State of California operating under multiple entities. License Numbers 01991628, 01527235, 01527365. All material is intended for informational purposes only and is compiled from sources deemed reliable but is subject to errors, omissions, changes in price, condition, sale, or withdrawal without notice. No statement is made as to the accuracy of any description or measurements (including square footage). This is not intended to solicit property already listed. No financial or legal advice provided. Equal Housing Opportunity. Photos may be virtually staged or digitally enhanced and may not reflect actual property conditions.
|
|
|
|
|
|
|